Industry report · Version 1.0 · Published: 30 October 2026 · Research cutoff: 28 October 2026.
Cover: AI-generated architectural illustration. It is not a photograph of One Vanderbilt or documentary evidence of the opening transaction.
English manuscript and evidence appendix · Evidence records · Value-chain graphic
The report covers income-producing offices, retail, logistics, hotels and data centers, with institutional rental housing included where source universes include it. The framework is global; company examples and financing analysis emphasize the United States, with Europe and mainland China as comparisons. Market size and sector shares refer to 2025; trading conditions cover H1 2026; the separate U.S. listed REIT snapshot is dated 30 September 2026. These are dated observations, not a claim of complete October market coverage.
Our assessment is that commercial real estate is recovering unevenly. A useful analysis connects tenant demand and the cost of keeping a building competitive with the owner’s debt schedule. Transaction recovery can improve liquidity while an individual property still requires new equity.
Part 1: Industry Story
A buyer returns to a Manhattan tower
On 15 October 2025, SL Green announced that Mori Building had bought another 5.0% interest in One Vanderbilt Avenue. The announcement put the building’s gross valuation at USD 4.7 billion and described it as fully leased. Mori’s own interim report confirms the additional investment. The price of the minority stake was not separately disclosed in these materials. [E01] [E02]
The building connects to Grand Central and combines offices with visitor and dining uses. Its owners were able to attract additional capital for this specific asset. Our interpretation is that access, the quality of the space and the activities around it can help an individual building compete for tenants. The transaction does not establish that ordinary offices have recovered to the same degree. [E01] [E02]
That distinction matters because a building has two customers. A tenant pays for useful space; a lender or equity investor funds the right to its future cash flows. Strong leasing cannot by itself fix a badly timed debt maturity. Conversely, access to refinancing cannot make an obsolete building useful. The Federal Reserve’s May 2026 assessment describes stabilizing commercial property markets alongside continuing refinancing vulnerability. This report examines how those operating and financing decisions meet. [E04]
Part 2: Industry Value Chain
Upstream capital and the ability to build
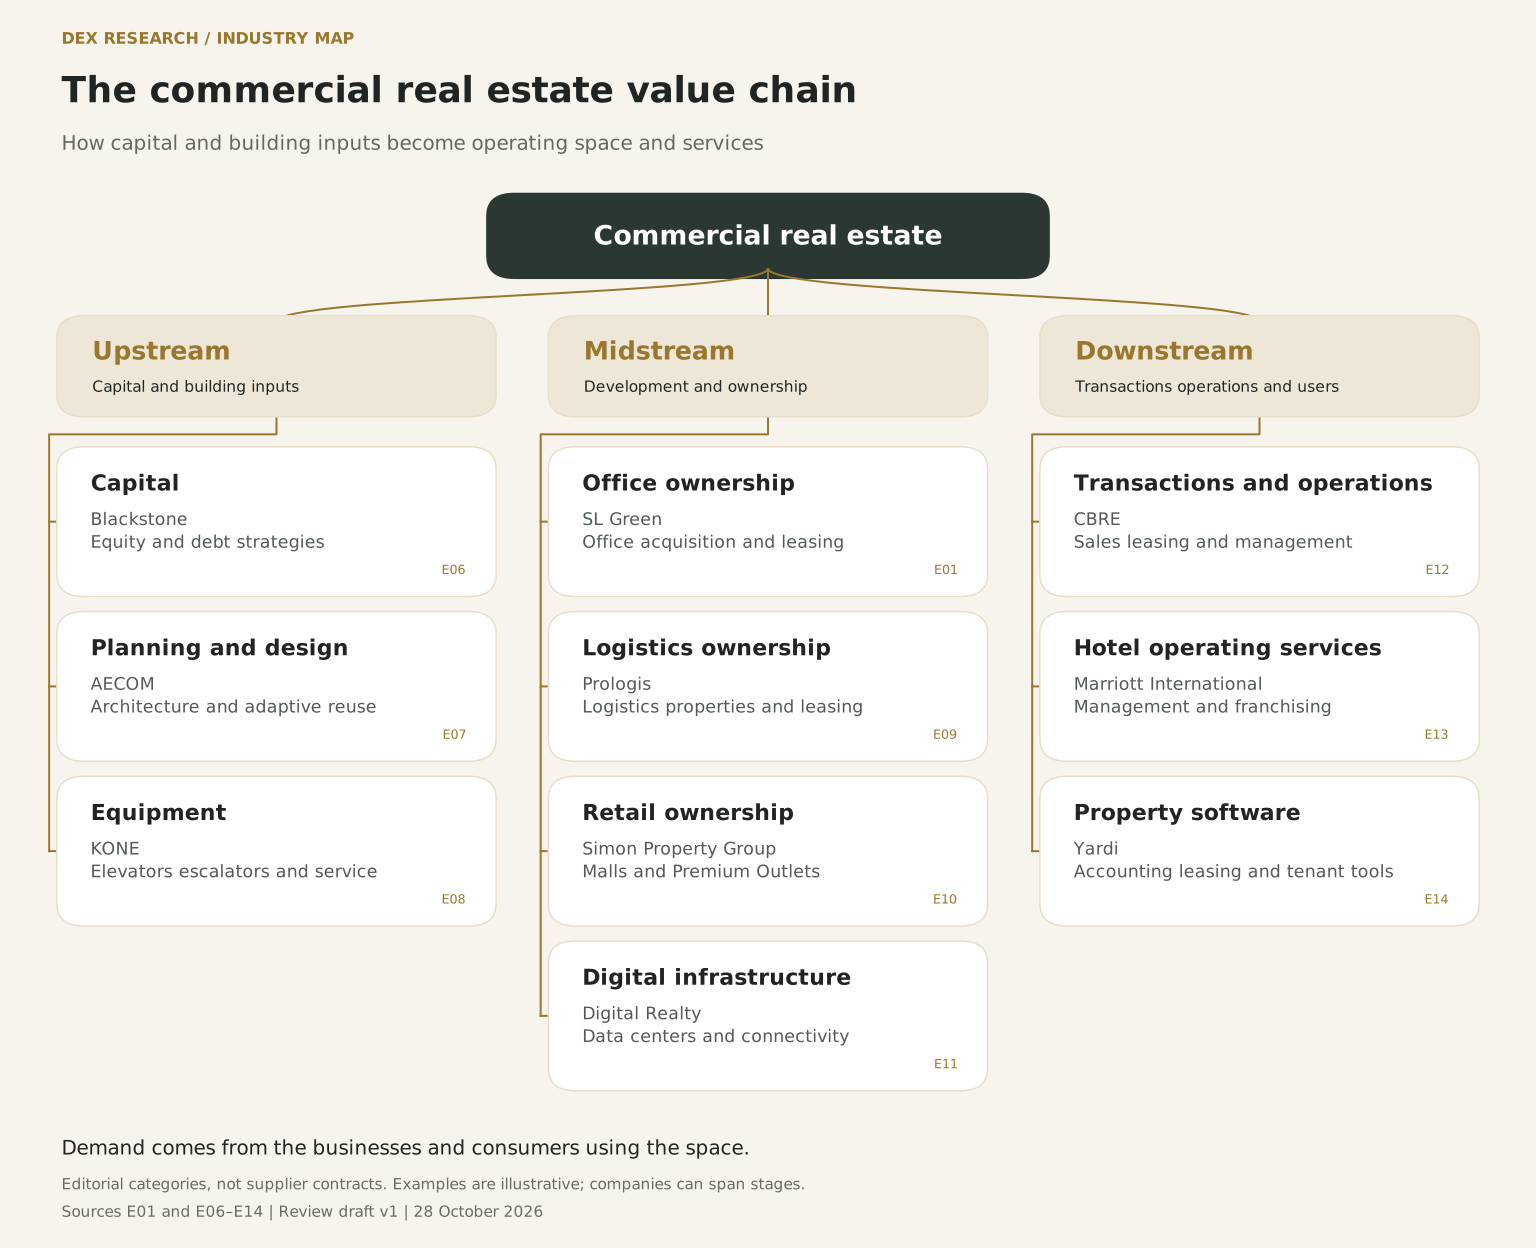
Upstream inputs include equity, credit, land rights, planning, design and building equipment. Banks and debt investors earn interest and fees while taking credit risk; fund managers raise equity and allocate it across projects. Blackstone’s disclosed real estate strategies span Core+, opportunistic equity and debt. This is an example of several ways capital can enter the same asset class, rather than an exclusive list of suppliers to the companies below. [E06]
Architects and engineers convert a site and a customer brief into a building that can be approved, constructed and operated. AECOM lists planning, architectural design, renovation and adaptive reuse among its services. Equipment makers such as KONE supply elevators and escalators and offer service over the building’s life. Design fees and equipment contracts fund delivery; later maintenance creates repeat work. These firms sell capabilities to developers and owners, but the map does not claim specific contracts between the examples. [E07] [E08]
Midstream development ownership and asset management
Developers coordinate approvals, construction, funding and initial leasing. Owners then choose the tenant mix, refurbishment budget and time to sell or refinance. A development profit depends on the spread between total project cost and the value supported by achievable income. Long-term ownership depends on collected rent after property expenses and on future capital requirements. Neither the building’s gross value nor a manager’s assets under management is the manager’s revenue.
SL Green illustrates office ownership; Prologis illustrates logistics property; Simon illustrates malls and outlets; Digital Realty illustrates data centers. Each combines assets with operating decisions, but their units of demand differ. Office leasing depends on the workplace; logistics on the movement of goods; retail on a merchant’s ability to trade; data centers on usable power and connectivity. In hotels, the property owner may hire a separate brand and operator. Marriott’s fee-driven model shows why a familiar hotel name need not identify the owner of its building. [E01] [E09] [E10] [E11] [E13]
Downstream transactions operations and users
Brokers connect owners with occupiers and buyers. Property managers handle building budgets, services and tenant relationships; facilities teams support the occupier’s workplace. CBRE operates across sales, leasing and these management services. Yardi supplies software for leasing, accounting and tenant workflows. Final demand comes from businesses and consumers using the space. These customers ultimately support the rent and service fees paid across the chain. [E12] [E14]
The upstream–midstream–downstream map follows how space is delivered and used. Capital also returns through sales and refinancing, and equipment maintenance continues after completion. A company can therefore appear at several stages. The map is an editorial classification with illustrative examples, not a ranking or a verified supply network.
INDUSTRY MAP
The commercial real estate value chain
Explore the capital, building inputs, ownership and services behind income-producing space.
Read the full text outline
- Commercial real estate
- Upstream · Capital and building inputs
- Capital
- Blackstone [E06]
- Equity and debt strategies
- Blackstone [E06]
- Planning and design
- AECOM [E07]
- Architecture and adaptive reuse
- AECOM [E07]
- Equipment
- KONE [E08]
- Elevators escalators and service
- KONE [E08]
- Capital
- Midstream · Development and ownership
- Office ownership
- SL Green [E01]
- Office acquisition and leasing
- SL Green [E01]
- Logistics ownership
- Prologis [E09]
- Logistics properties and leasing
- Prologis [E09]
- Retail ownership
- Simon Property Group [E10]
- Malls and Premium Outlets
- Simon Property Group [E10]
- Digital infrastructure
- Digital Realty [E11]
- Data centers and connectivity
- Digital Realty [E11]
- Office ownership
- Downstream · Transactions operations and users
- Transactions and operations
- CBRE [E12]
- Sales leasing and management
- CBRE [E12]
- Hotel operating services
- Marriott International [E13]
- Management and franchising
- Marriott International [E13]
- Property software
- Yardi [E14]
- Accounting leasing and tenant tools
- Yardi [E14]
- Transactions and operations
- Upstream · Capital and building inputs
Editorial categories, not verified supplier contracts. Company examples are illustrative, non-exclusive and unranked; firms can span several stages. Source IDs resolve in the evidence appendix.
Sources: Evidence and methods E01 and E06–E14. Reviewed 2026-10-28.
Part 3: Market Landscape
Define the market before measuring it
MSCI’s 2025 institutional investment-property universe across 38 markets was USD 13.5 trillion, up 8.5%, much of it from currency effects. Within that same universe, offices held 26.8% and industrial property, including data centers, held 20.5%. The remaining 52.7% is calculated as a residual. Figure 2 therefore shows sector shares of a defined asset stock. It measures neither corporate revenue shares nor the entire world’s buildings. [E03]
Three commonly quoted numbers answer different questions. The Federal Reserve reports USD 22.083 trillion of U.S. CRE value for Q4 2025, using a broader asset measure. Nareit reports approximately USD 1.45 trillion of equity market capitalization for listed U.S. equity REITs at 30 September 2026. The first concerns buildings; the second concerns listed equity claims after the effects of debt and equity pricing. Dividing either by MSCI’s global institutional subset would produce a misleading “market share.” [E04] [E18]
Competition depends on the property and the service
Commercial property has local substitutes: a tenant can compare nearby offices or warehouses, but cannot move an occupied building to another city. At the asset level, location, planning rights, physical specifications and replacement cost shape competition. Large specialist owners can spread tenant relationships, engineering and financing across portfolios. Smaller local owners can compete through a particular site, flexibility or local knowledge. The available evidence does not support a single global company-share ranking across these different assets.
Financial sponsors, specialist owners, service platforms and hotel brands also compete for different earnings. A sponsor can earn management fees and investment gains; an owner earns property income; a broker earns transaction fees; a software firm sells access to its system. A new entrant may acquire a building through a joint venture or enter through a service without owning property. Scaling either route requires winning customers and paying the cost of delivery. Brand reach, managed area and owned asset value should remain separate measures. [E06] [E12] [E13] [E14]
A recovery in activity with differences across assets
JLL reports Q2 2026 global direct investment volume up 28% year on year, while H1 office leasing activity rose 1%. The series measure different activities, but together they show why improving capital-market liquidity need not mean a comparable surge in occupier demand. Underwriting still requires local vacancy, lease expiries and incentives rather than an extrapolation from global transaction growth. [E05]
In logistics, Prologis reported 228 million square feet of lease signings in 2025 and Q4 owned-and-managed average occupancy of 95.3%. This is a useful operating reference, not a market-wide occupancy rate. The distinction between a signed lease, its commencement and net absorption matters: renewals support continuity but do not necessarily represent newly occupied space. A logistics owner’s competitive advantage is more durable when tenants need the location for their distribution network. [E09]
Retail income requires a closer look at the lease economics. Simon’s selected U.S. mall and outlet new leases carried initial annual base rent of USD 65.09 per square foot in 2025 and an average tenant allowance of USD 63.92 per square foot. The allowance is a separate capital commitment, not an annual expense with the same time basis. A headline rent therefore needs a bridge to cash retained after leasing and refurbishment costs. [E10]
Data centers require delivery of both physical space and technical capacity. Digital Realty had 769MW of projects underway at year-end 2025, 64% pre-leased. Pre-leasing helps establish prospective demand; construction completion, available power and customer commencement still determine when income can arrive. Announced capacity must therefore be distinguished from operating capacity and billed utilization. [E11]
Profitability and regional differences
Service-company scale also needs normalization. CBRE reported USD 40.550 billion of 2025 revenue, including USD 16.746 billion of reimbursable pass-through costs. Comparing that headline directly with a landlord’s rent revenue would confuse different business models. Our analytical preference is to examine recurring fees, property cash income, capital expenditure and financing separately, using each company’s reconciliations where non-GAAP measures are involved. [E12]
The regional comparison is institutional as well as economic. U.S. evidence here offers detailed listed-company and financing disclosures. The ECB’s 2025 supervisory review highlights pressure in non-prime offices and differences among bank exposures. Mainland China introduced a commercial real estate REIT pilot effective 31 December 2025. Our inference is that a potential capital-recycling route increases the importance of operating records, asset governance and cash-flow transparency; it does not create rental demand by itself. [E16] [E17]
Part 4: Industry Problems
Refinancing can consume the owner’s equity
A loan maturity forces a new lending decision at today’s income, valuation and credit terms. To illustrate the mechanism, assume a property produces USD 6m of annual net operating income. At a 5% capitalization rate its indicated value is USD 120m; at 6% it is USD 100m, a 16.7% decline with unchanged income. If refinancing is capped at 60% loan-to-value against a USD 70m maturing balance, the new USD 60m loan leaves a USD 10m equity gap before fees. These are author-selected assumptions, not a market observation or forecast. Actual loan sizing also depends on debt-service coverage.
Owners can retain cash, inject equity, sell assets, hedge rates or negotiate a credible workout. Each has a cost. An extension can bridge a temporary liquidity problem but cannot restore permanently lost demand. Lenders need updated valuations and operating information rather than assuming a higher future sale price will close every gap. The Federal Reserve’s stabilization assessment should be read with its continuing refinancing concern. [E04]
Leasing success can hide the cost of remaining competitive
An occupied building can still face expensive lease renewals, fit-outs and equipment replacement. The ECB identifies remote working and repricing in non-prime offices as structural pressures. Our assessment is that a viable response starts with a building-level plan: upgrade where a defensible rent supports the cost; change use only where layout, approvals and conversion economics allow it. Discounting rent may attract tenants but can weaken the income available for the same refurbishment. [E16]
Power availability constrains some fast-growing uses
The IEA’s April 2025 model estimated global data-center electricity use at about 415TWh in 2024 and projected 945TWh in its 2030 Base Case. This is a dated scenario, not a newly observed demand total. Its discussion of concentrated local loads and longer energy-system lead times explains a delivery risk: land and customer interest can arrive before usable grid capacity. Phased development, demand verification and early power agreements can reduce exposure, but cannot eliminate grid constraints or uncertainty about future computing efficiency. [E15]
Financial reporting and incentives can obscure cash returns
Rent growth, occupancy, investment activity and fund distributions describe different outcomes. A manager paid on asset size may favor expansion; an owner must fund capital expenditure and debt service. The analytical response is a consistent bridge from contractual rent to collections, operating expenses, leasing costs, maintenance capital and financing. Check what is consolidated, held through a joint venture or only managed. The Simon allowance and CBRE pass-through examples show how attractive headline metrics can require very different adjustments. [E10] [E12]
What would change our assessment
A broader recovery would be more convincing if occupancy and cash rent improved while leasing incentives and refinancing equity gaps declined. A deterioration would be more concerning if new supply and weak collections met a cluster of loan maturities. For each asset, monitor lease expiries, cash retained after recurring investment, debt maturity and rate resets, and committed future spending. For data centers add deliverable power and customer commencement. These are monitoring criteria derived from the mechanisms above, not predictions of returns.
Appendix: Evidence and Methods
Evidence method. [E01] to [E18] identify the inspected primary records, issuer filings and publisher research pages. Company releases establish attributed facts about those companies; they do not independently establish an industry ranking. The report’s explanations of incentives, competition and the financing example are author analysis. No inaccessible report or search snippet is treated as a read full text.
Figure 1. Commercial real estate value chain. Category links show editorial groupings, not supplier contracts. Examples are not exhaustive and firms may operate across stages. Sources: E01, E06–E14. An overview and three detailed branch images are supplied, with editable SVG and the common authoring source.
Figure 2. Global institutional investment-property value shares, 2025, MSCI 38-market universe. Offices 26.8%; industrial including data centers 20.5%; all other sectors 52.7%. The source publishes the first two shares in its public preview. Residual = 100 − 26.8 − 20.5. Categories are mutually exclusive under that source definition. Percentages sum to 100.0%; published rounding is retained. The residual pools all other property types and is not an estimate of a single sector. No corporate concentration follows from it. Source E03.
Illustrative financing arithmetic. USD 6m / 0.05 = USD 120m; USD 6m / 0.06 = USD 100m; change = (100 / 120 − 1) × 100 = −16.6667%, rounded to −16.7%. USD 100m × 60% = USD 60m; USD 70m − USD 60m = USD 10m. Assumptions exclude fees, amortization, taxes, reserves and coverage constraints. This is a teaching calculation, not a property appraisal.
[E01] SL Green Realty
Mori Building Co Ltd Completes Additional Investment in SL Green’s One Vanderbilt Avenue
Publication: 2025-10-15. Period: Transaction announced as completed on 2025-10-15. Read: 28 October 2026.
Location: Opening two paragraphs and property description.
Supports the additional 5.0% interest, USD 4.7bn gross property valuation and seller-reported full leasing. A party announcement; valuation is not the disclosed cash price for the stake, and one tower does not establish a market average.
[E02] Mori Building
Interim Financial Report for Fiscal Year Ending March 2026 FY2025
Publication: 2025 interim report; exact release day not identified in the inspected PDF. Period: FY ending March 2026 interim reporting. Read: 28 October 2026.
Location: PDF page 27, An Additional Stake Acquired in One Vanderbilt Avenue in USA.
Buyer-side confirmation of an additional investment and the transit-connected mixed-use property. Corroborates participation, but does not independently confirm E01’s valuation or leasing metric.
[E03] MSCI; Razia Neshat, Rishikesh Patkar and Hariharan G G
Publication: 2026-08-03. Period: 2025; 38 markets. Read: 28 October 2026.
Location: Public Preview, three bullets on market size and sector weights.
Public preview supports USD 13.5tn, 8.5% expansion, office 26.8% and industrial 20.5%, including data centers. Full gated paper was not retrieved. Other sectors = 100 − 26.8 − 20.5 = 52.7%; no more detailed split is inferred.
[E04] Federal Reserve Board
Financial Stability Report May 2026 Asset Valuations
Publication: 2026-05; exact day not stated on inspected chapter. Period: Table 1.1 through 2025 Q4; report market conditions through 2026-04-23. Read: 28 October 2026.
Location: Table 1.1, notes and CRE discussion.
U.S. CRE nominal market value USD 22,083bn and stabilizing conditions with refinancing vulnerability. Broader U.S. asset measure, not the institutional subset in E03. Dollar levels cannot form a comparable regional market-share calculation.
[E05] JLL Research
Global Real Estate Perspective August 2026
Publication: 2026-08-03. Period: 2026 Q2 and H1; year-on-year comparisons. Read: 28 October 2026.
Location: Capital deployment continues to build and Offices subsections.
Direct investment volume grew 28% year on year in Q2; global office leasing grew 1% in H1. Brokerage research, not an official census; activity growth does not measure values, occupancy or profit growth.
[E06] Blackstone
Publication: Undated live business page; read 2026-10-28. Period: Business descriptions as displayed on retrieval. Read: 28 October 2026.
Location: Our Real Estate Investment Strategies, Opportunistic, Core+ and Debt.
Supports the named manager’s equity and debt strategies. Company description is evidence of its business scope, not independent leadership, returns or industry concentration.
[E07] AECOM
Architectural design excellence
Publication: Undated live service page; read 2026-10-28. Period: Service description at retrieval. Read: 28 October 2026.
Location: Opening architecture paragraphs and service list.
Architectural design, planning, renovation and adaptive reuse. Does not establish a contract with any other named company or quantify design-market share.
[E08] KONE
KONE elevators and escalators for new buildings
Publication: Undated live product page; read 2026-10-28. Period: Offering at retrieval. Read: 28 October 2026.
Location: Design Build Service and frequently asked questions.
Elevators, escalators and maintenance across building types. Product descriptions do not verify a particular building installation or an equipment supplier ranking.
[E09] Prologis
Prologis Reports Fourth Quarter and Full Year 2025 Results
Publication: 2026-01-21. Period: 2025 full year and 2025 Q4. Read: 28 October 2026.
Location: Exhibit 99.2, opening and Operating Performance table, printed page 1.
228m sq ft of annual lease signings; owned-and-managed Q4 average occupancy 95.3%. Signings are not net absorption or commenced leases, and the portfolio is not the entire logistics market.
[E10] Simon Property Group
Publication: 2026 annual report; exact release day not identified in inspected PDF. Period: Year ended 2025-12-31. Read: 28 October 2026.
Location: PDF page 77, Current Leasing Activities.
U.S. malls and Premium Outlets new-lease initial annual base rent USD 65.09/sq ft; tenant allowance USD 63.92/sq ft, with source exclusions. Different time bases and no disclosed amortization period: subtracting them is not a valid annual margin.
[E11] Digital Realty Trust
Form 10 K for year ended December 31 2025
Publication: 2026 filing; exact filing day not asserted. Period: 2025-12-31. Read: 28 October 2026.
Location: Item 1, Our Data Center Portfolio, paragraph on projects underway.
769MW under development, 64% pre-leased. A company development pipeline; neither global capacity share nor a guarantee of delivered power, recognized revenue or returns.
[E12] CBRE Group
Form 10 K for year ended December 31 2025
Publication: 2026 filing; exact filing day not asserted. Period: 2025 full year. Read: 28 October 2026.
Location: Item 1 business segments; Item 7 Results of Operations, printed pages 26 to 32.
Property sales, leasing, management and facilities services; revenue USD 40,550m and pass-through costs USD 16,746m. Revenue is not property transaction value, economic fee income or industry market share.
[E13] Marriott International
Publication: 2026 annual report; exact release day not identified in inspected PDF. Period: Year ended 2025-12-31. Read: 28 October 2026.
Location: Letter to Stockholders, Financial Performance; Form 10 K Item 2 Properties.
Supports fee-driven franchising, management and licensing. Brand-system reach does not measure the value or area of hotels owned by the brand company.
[E14] Yardi
Commercial Property Management Software
Publication: Undated live product page; read 2026-10-28. Period: Product offering at retrieval. Read: 28 October 2026.
Location: Commercial solutions and product descriptions.
Property accounting, leasing, budgeting and tenant-service software. Vendor claims establish offered functions, not verified client savings or market leadership.
[E15] International Energy Agency
Energy and AI Energy demand from AI
Publication: 2025-04-10. Period: 2024 estimate and 2030 Base Case projection. Read: 28 October 2026.
Location: The outlook for energy demand from data centres.
Around 415TWh in 2024 and 945TWh in the 2030 Base Case. This is a dated model with scenario uncertainty, not a 2026 forecast update or contracted local electricity demand.
[E16] ECB Banking Supervision
Aggregated results of the 2025 SREP
Publication: 2025 SREP; chapter notes a 2026-04-02 amendment. Period: 2025 supervisory assessment. Read: 28 October 2026.
Location: Section 5.3 Credit risk, CRE paragraphs.
Remote working, non-prime office repricing, climate considerations and refinancing risks. Supervisory assessment of covered banks, not a uniform conclusion about all European buildings.
[E17] China Securities Regulatory Commission
CSRC announcement introducing a commercial real estate REIT pilot
Publication: 2025-12-31. Period: Announced effective 2025-12-31. Read: 28 October 2026.
Location: Opening and paragraph summarizing the eight provisions.
Dated introduction of the pilot and active operating-management responsibility. This report does not assert that every asset qualifies or review every subsequent implementing rule. Official Chinese title: 中国证监会关于推出商业不动产投资信托基金试点的公告.
[E18] Nareit
REIT Industry Financial Snapshot
Publication: September 2026 data edition; exact release day not shown. Period: Market values 2026-09-30; ratios separately dated Q2 2026. Read: 28 October 2026.
Location: Industry Size and data date note.
Rounded USD 1.45tn equity capitalization for FTSE Nareit All Equity REITs. This measures listed equity claims, not gross underlying property value, and is not a global industry denominator.