Industry brief · Version 1.0 · Global scope · Research cutoff: 24 October 2026.
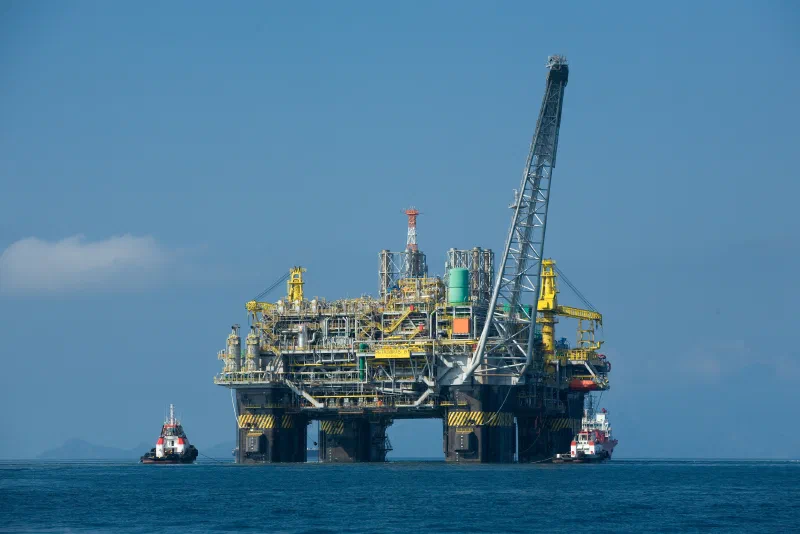
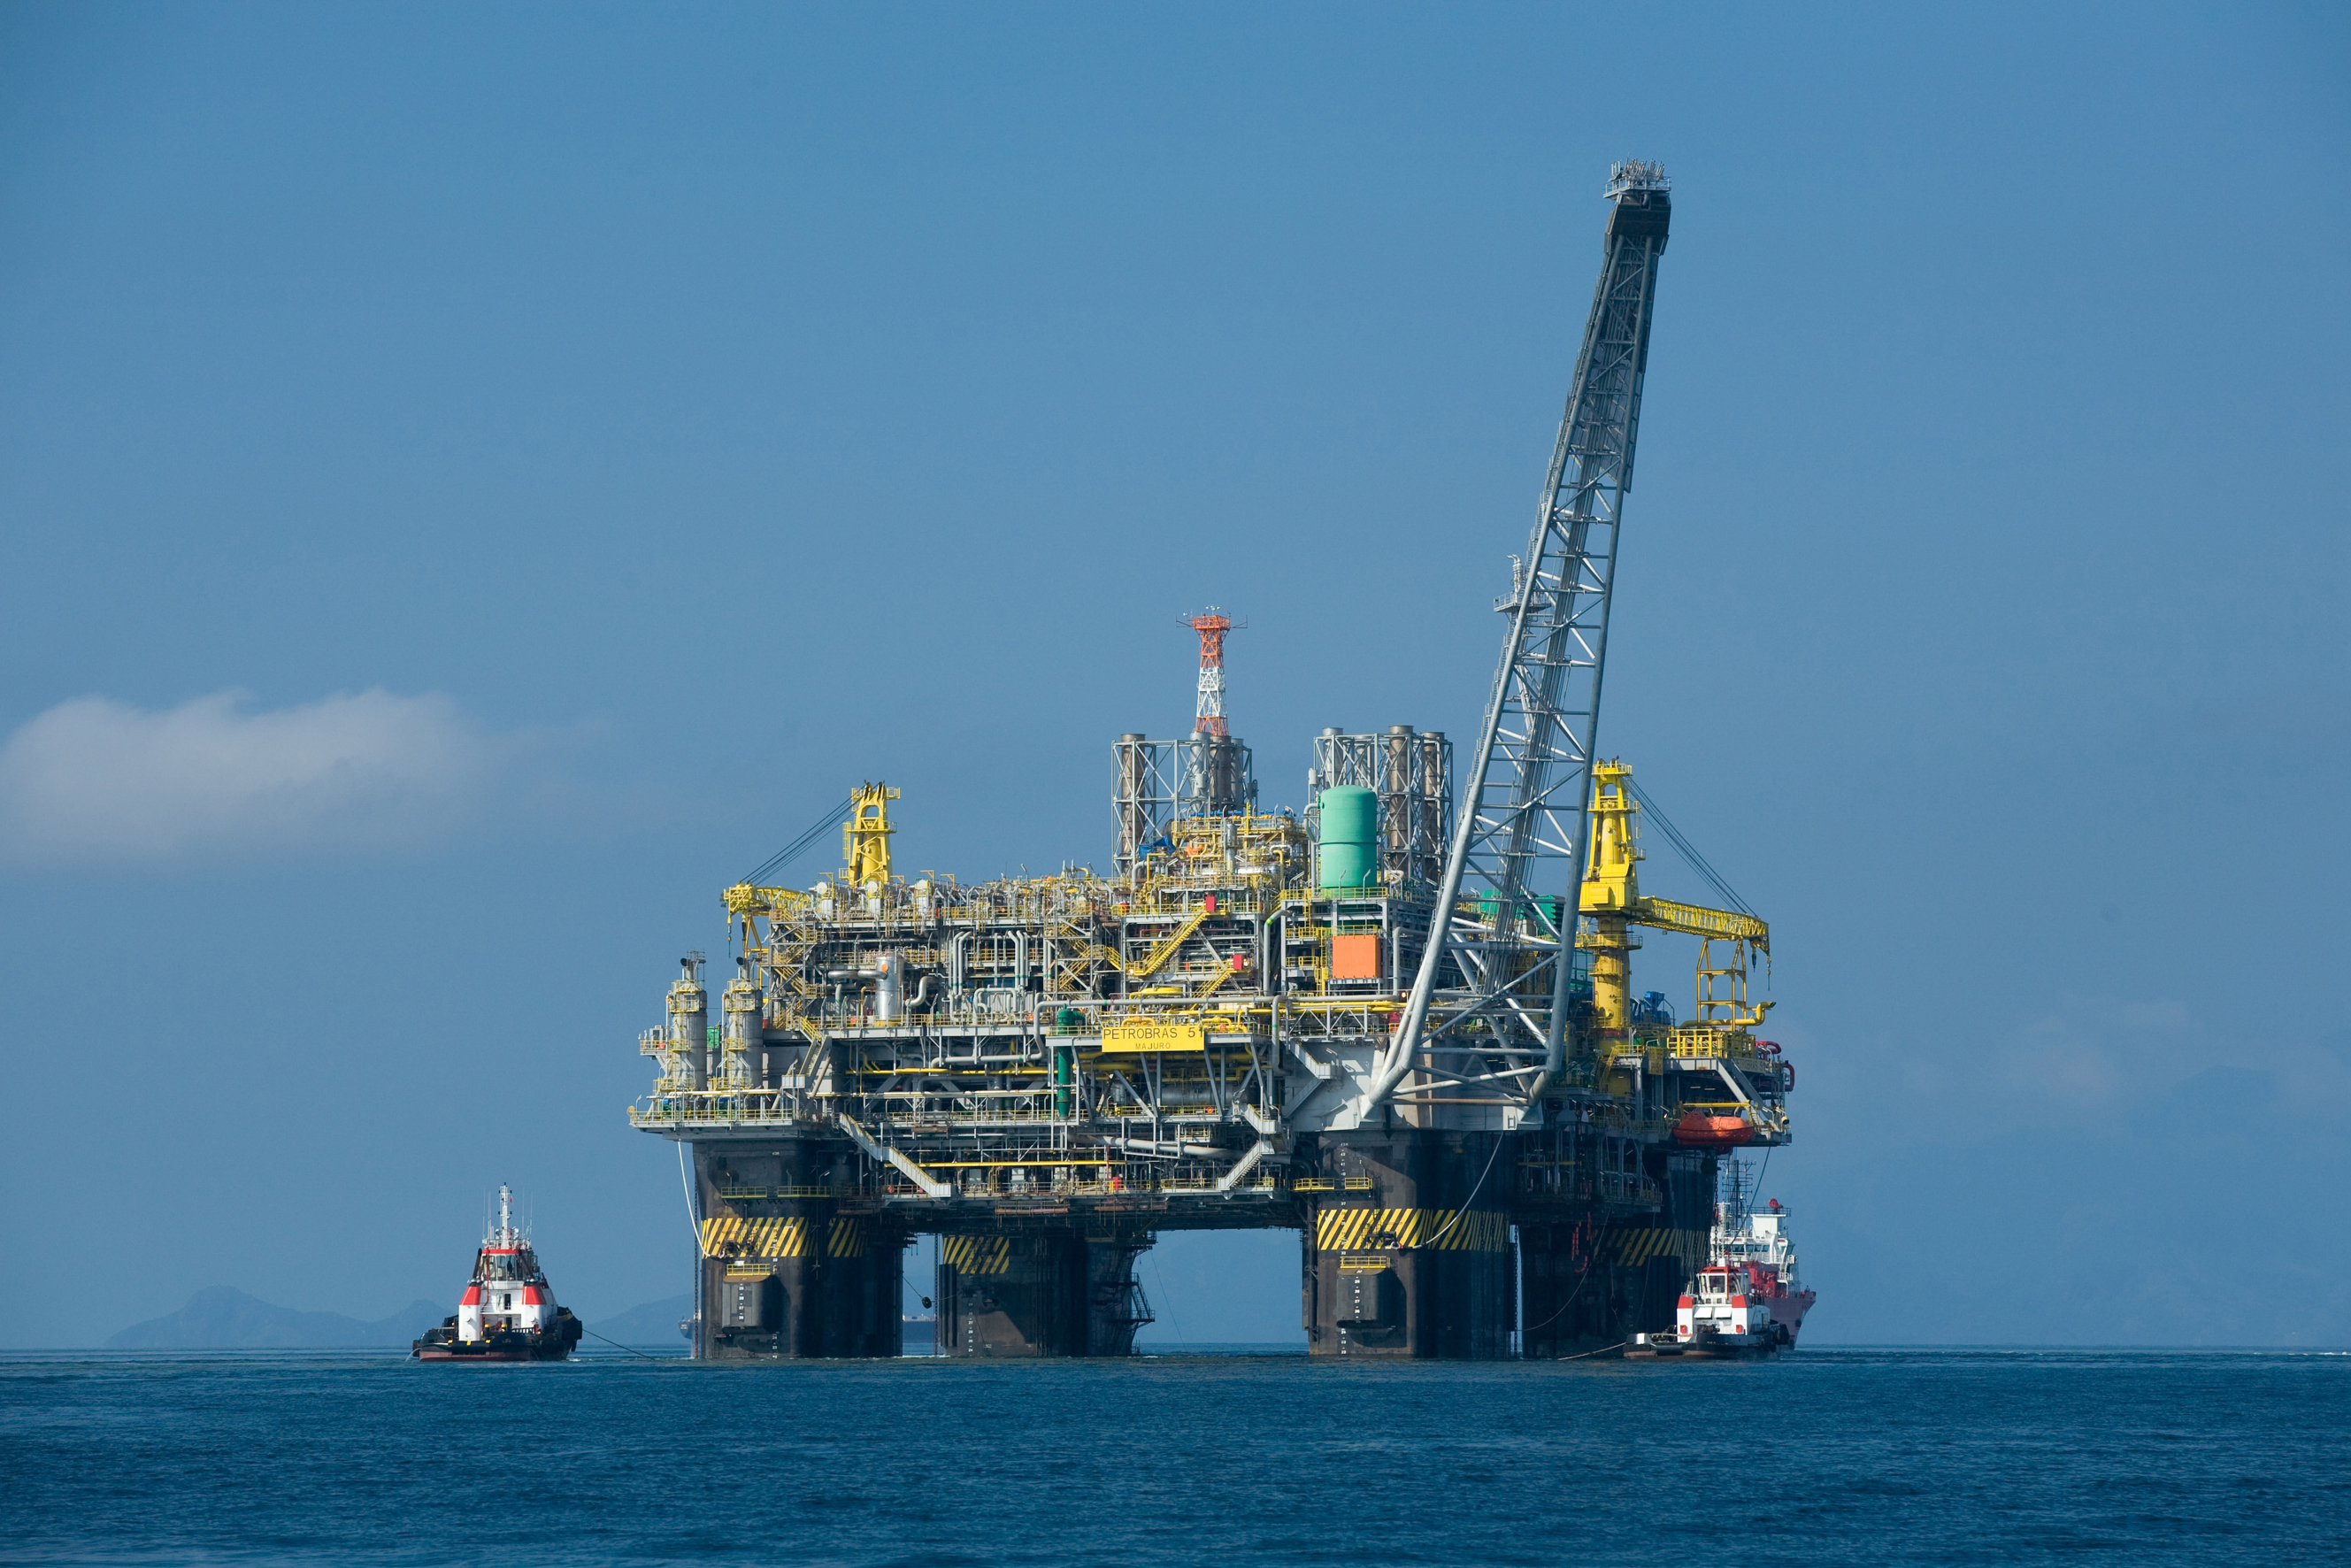
Petrobras P-51 offshore platform, Brazil. Historical industry illustration; not the ONE GUYANA vessel discussed below. Photo: Divulgação Petrobras / ABr — Oil platform P-51 (Brazil), image record dated 2 January 2009, CC BY 3.0 BR. Resized and displayed with cover cropping. View original photograph.

Complete English manuscript · Evidence records · Chart inputs and calculations
Scope: global exploration and production (E&P), using full-year 2025 output as the comparable baseline. Developments are reviewed through 24 October 2026. Midstream and downstream explain the route to market.
Core view: E&P is a business of replacing production, managing subsurface uncertainty and recovering long-lived capital. Resource quality, access to market and lifetime costs reveal more about competitiveness than output growth alone. This is the author’s interpretation of the evidence below.
Part 1: Industry Story
On 8 August 2025, the ONE GUYANA floating production, storage and offloading vessel (FPSO) started producing oil offshore Guyana. ExxonMobil and the Guyanese government announced the startup. Its initial annual-average production target was 250,000 barrels a day; installed capacity across the relevant developments exceeded 900,000 barrels a day. Neither figure describes full-year 2025 actual production. [S02] [S03]
The vessel makes an otherwise hidden industrial process tangible. A discovery still needs appraisal wells, development design, finance, equipment, subsea connections and commissioning before it produces a deliverable commodity. Resource discovery starts the process; execution, uptime and sales determine whether it generates cash.
On 4 February 2026, SBM Offshore announced the vessel’s sale for approximately US$2.32 billion in cash, while retaining operations and maintenance through 2035. This disclosed transaction shows how field interests, facility ownership and operating services can be separated. The vessel price is not the total cost of developing the field. [S04]
The resulting questions extend beyond how much oil the world needs: who obtains attractive resources, who delivers projects, and which assets can withstand lower prices, interruptions or delays?
Part 2: Industry Value Chain
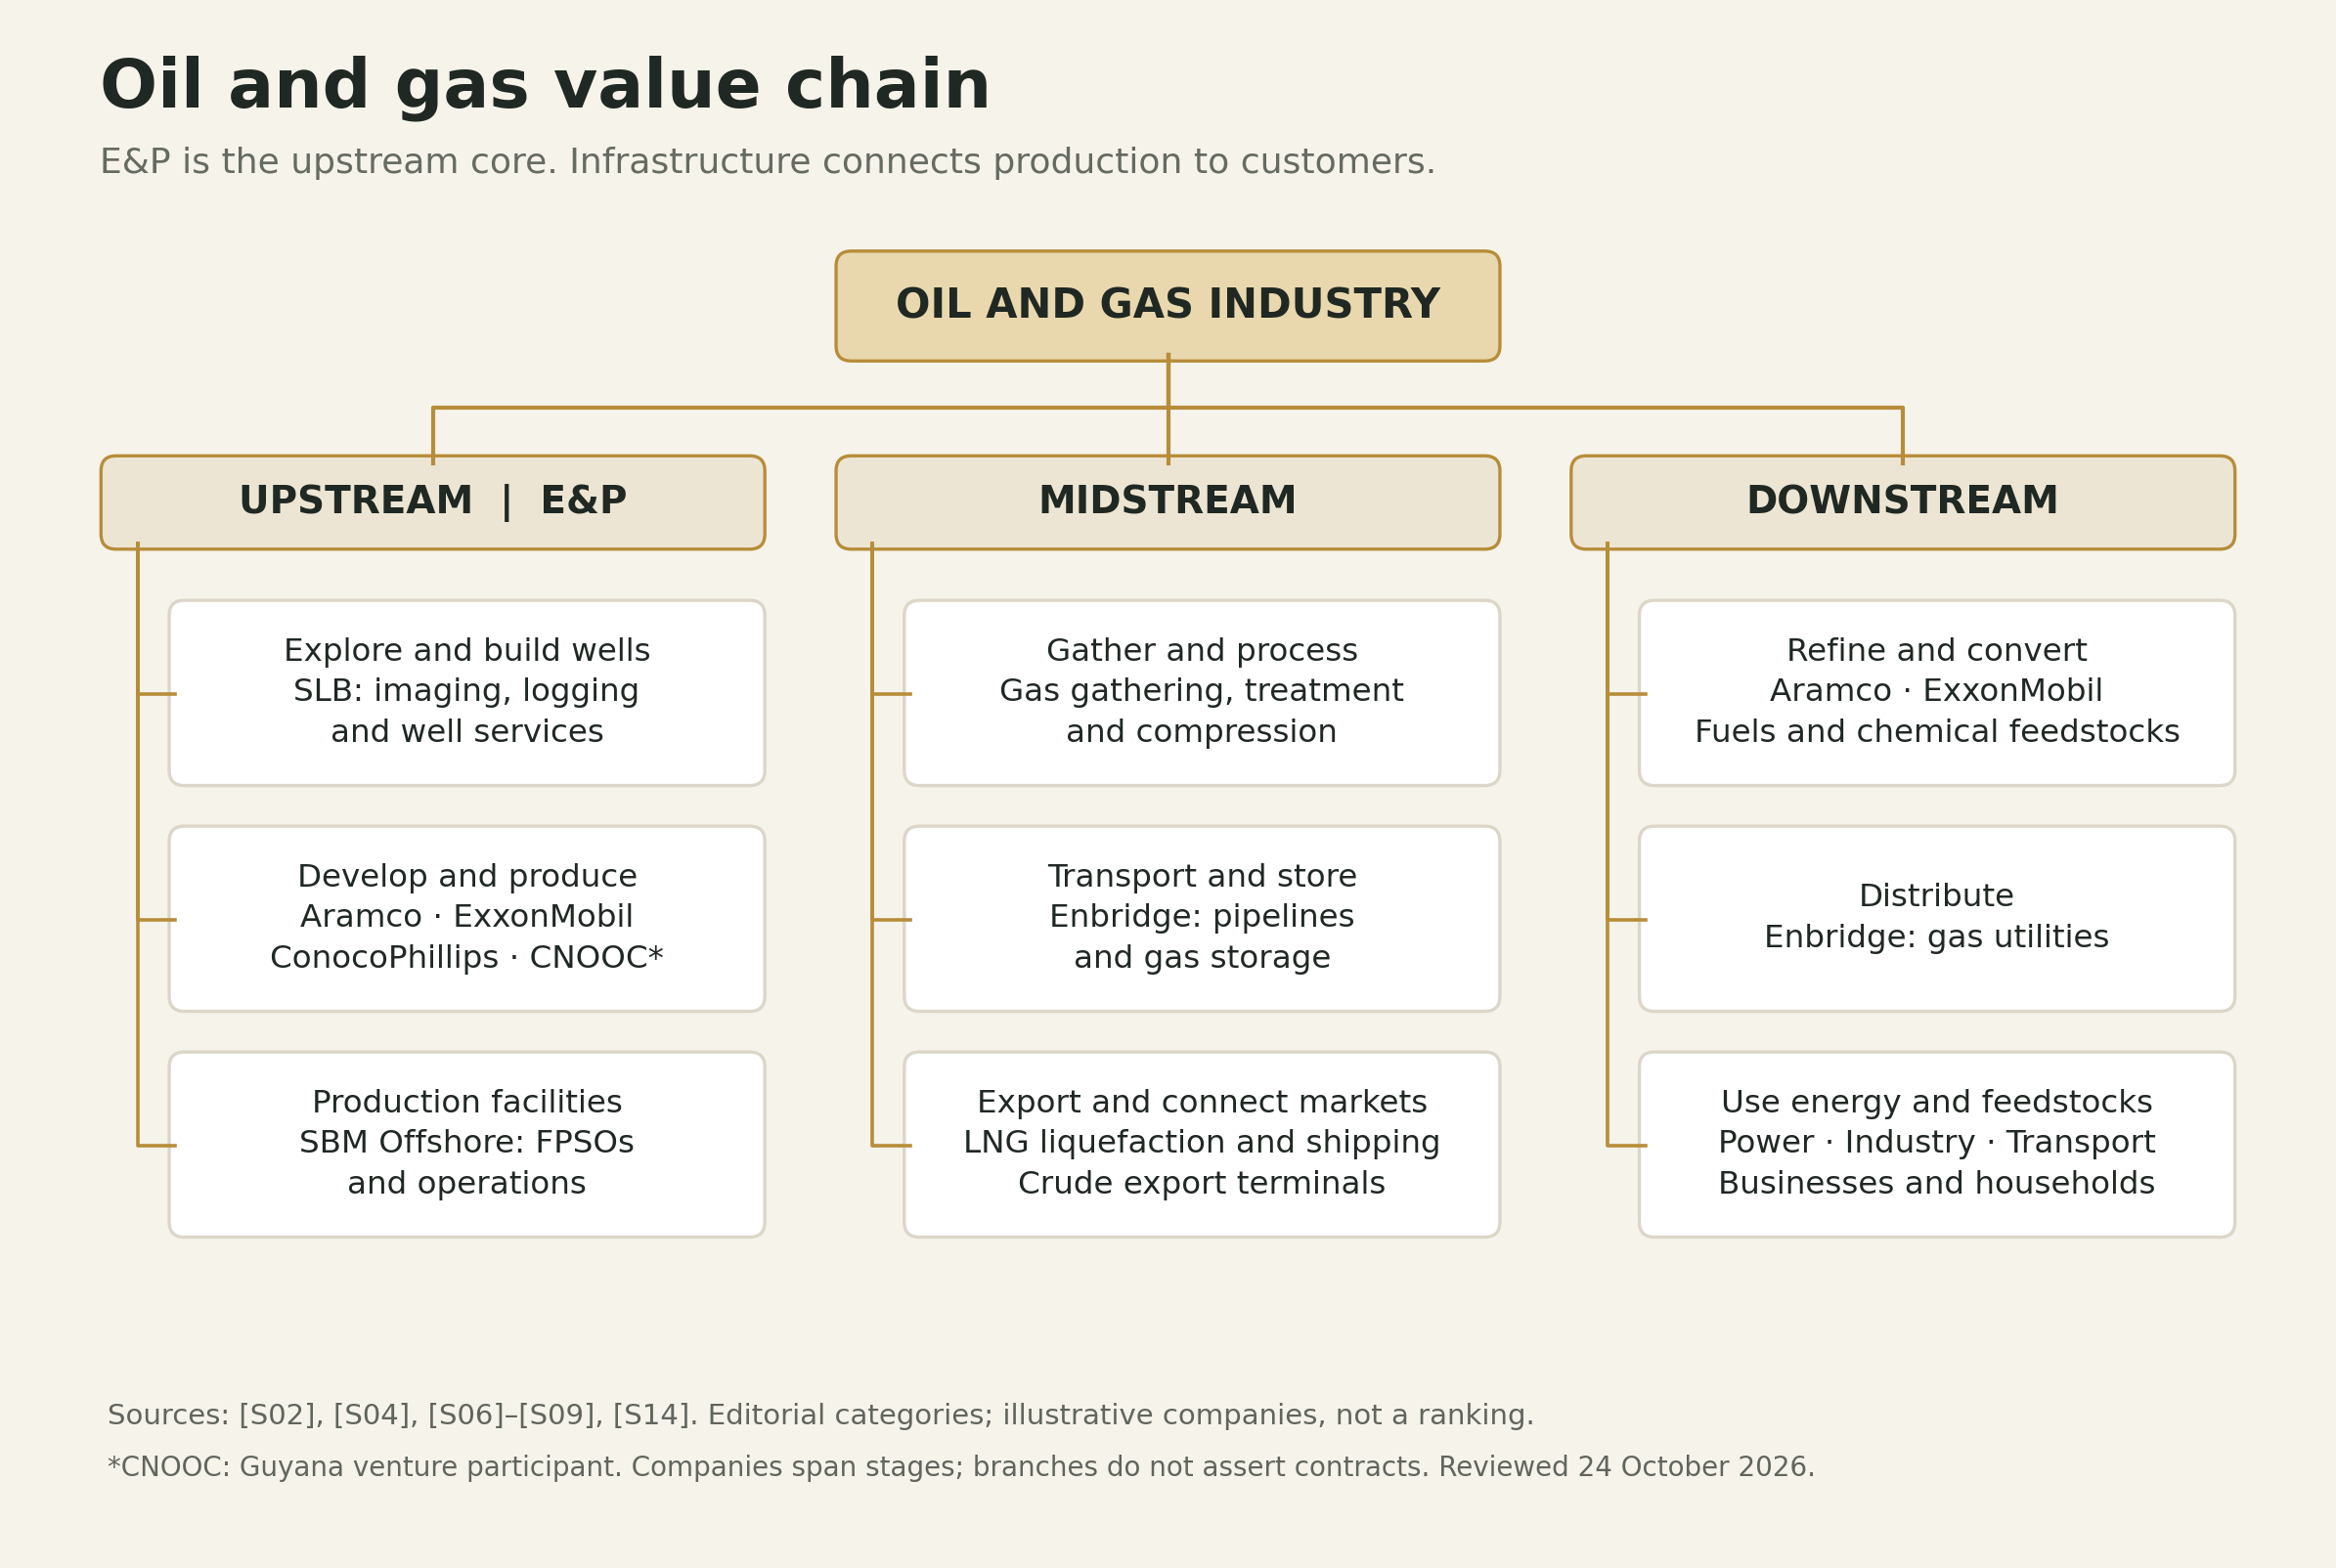
Upstream is the focus: exploration, appraisal, development and production. Producers commit capital and bear geological and commodity-price risk, selling to refiners, traders or gas buyers. Aramco, ExxonMobil, the Guyana venture involving CNOOC, and independent E&P company ConocoPhillips illustrate different business models. [S02] [S07] [S09]
Suppliers provide tools and delivery capability. SLB offers reservoir characterisation, well construction, production and abandonment services; SBM supplies FPSO construction and operations. Equipment, service, lease and maintenance revenue must not simply be added to producers’ sales as a non-overlapping industry total. [S04] [S06]
Midstream gathers, processes, transports and stores output; Enbridge illustrates pipelines and gas storage. LNG facilities connect gas to distant markets. Downstream turns crude into fuels and chemical feedstocks or delivers gas to power, industrial and household users. Aramco and ExxonMobil span multiple stages; Enbridge also distributes gas. [S02] [S07] [S08] [S14]
INDUSTRY MAP
The oil and gas value chain
E&P is the upstream core. Infrastructure connects production to customers.
Read the full text outline
- Oil and gas industry
- Upstream | E&P
- Explore and build wells
- SLB: imaging, logging and well services
- Develop and produce
- Aramco
- ExxonMobil
- ConocoPhillips
- CNOOC: Guyana venture participation
- Production facilities
- SBM Offshore: FPSOs and operations
- Explore and build wells
- Midstream
- Gather and process
- Gas gathering, treatment and compression
- Transport and store
- Enbridge: pipelines and gas storage
- Export and connect markets
- LNG liquefaction and shipping
- Crude export terminals
- Gather and process
- Downstream
- Refine and convert
- Aramco and ExxonMobil: fuels and chemical feedstocks
- Distribute
- Enbridge: gas utilities
- Use energy and feedstocks
- Power, industry and transport
- Businesses and households
- Refine and convert
- Upstream | E&P
Editorial categories and illustrative companies, not a ranking. Companies span stages; branches do not assert supply contracts. Source IDs: S02, S04, S06–S09 and S14.
Sources: Evidence and sources. Reviewed 2026-10-24.
View the printable industry map
Part 3: Market Landscape
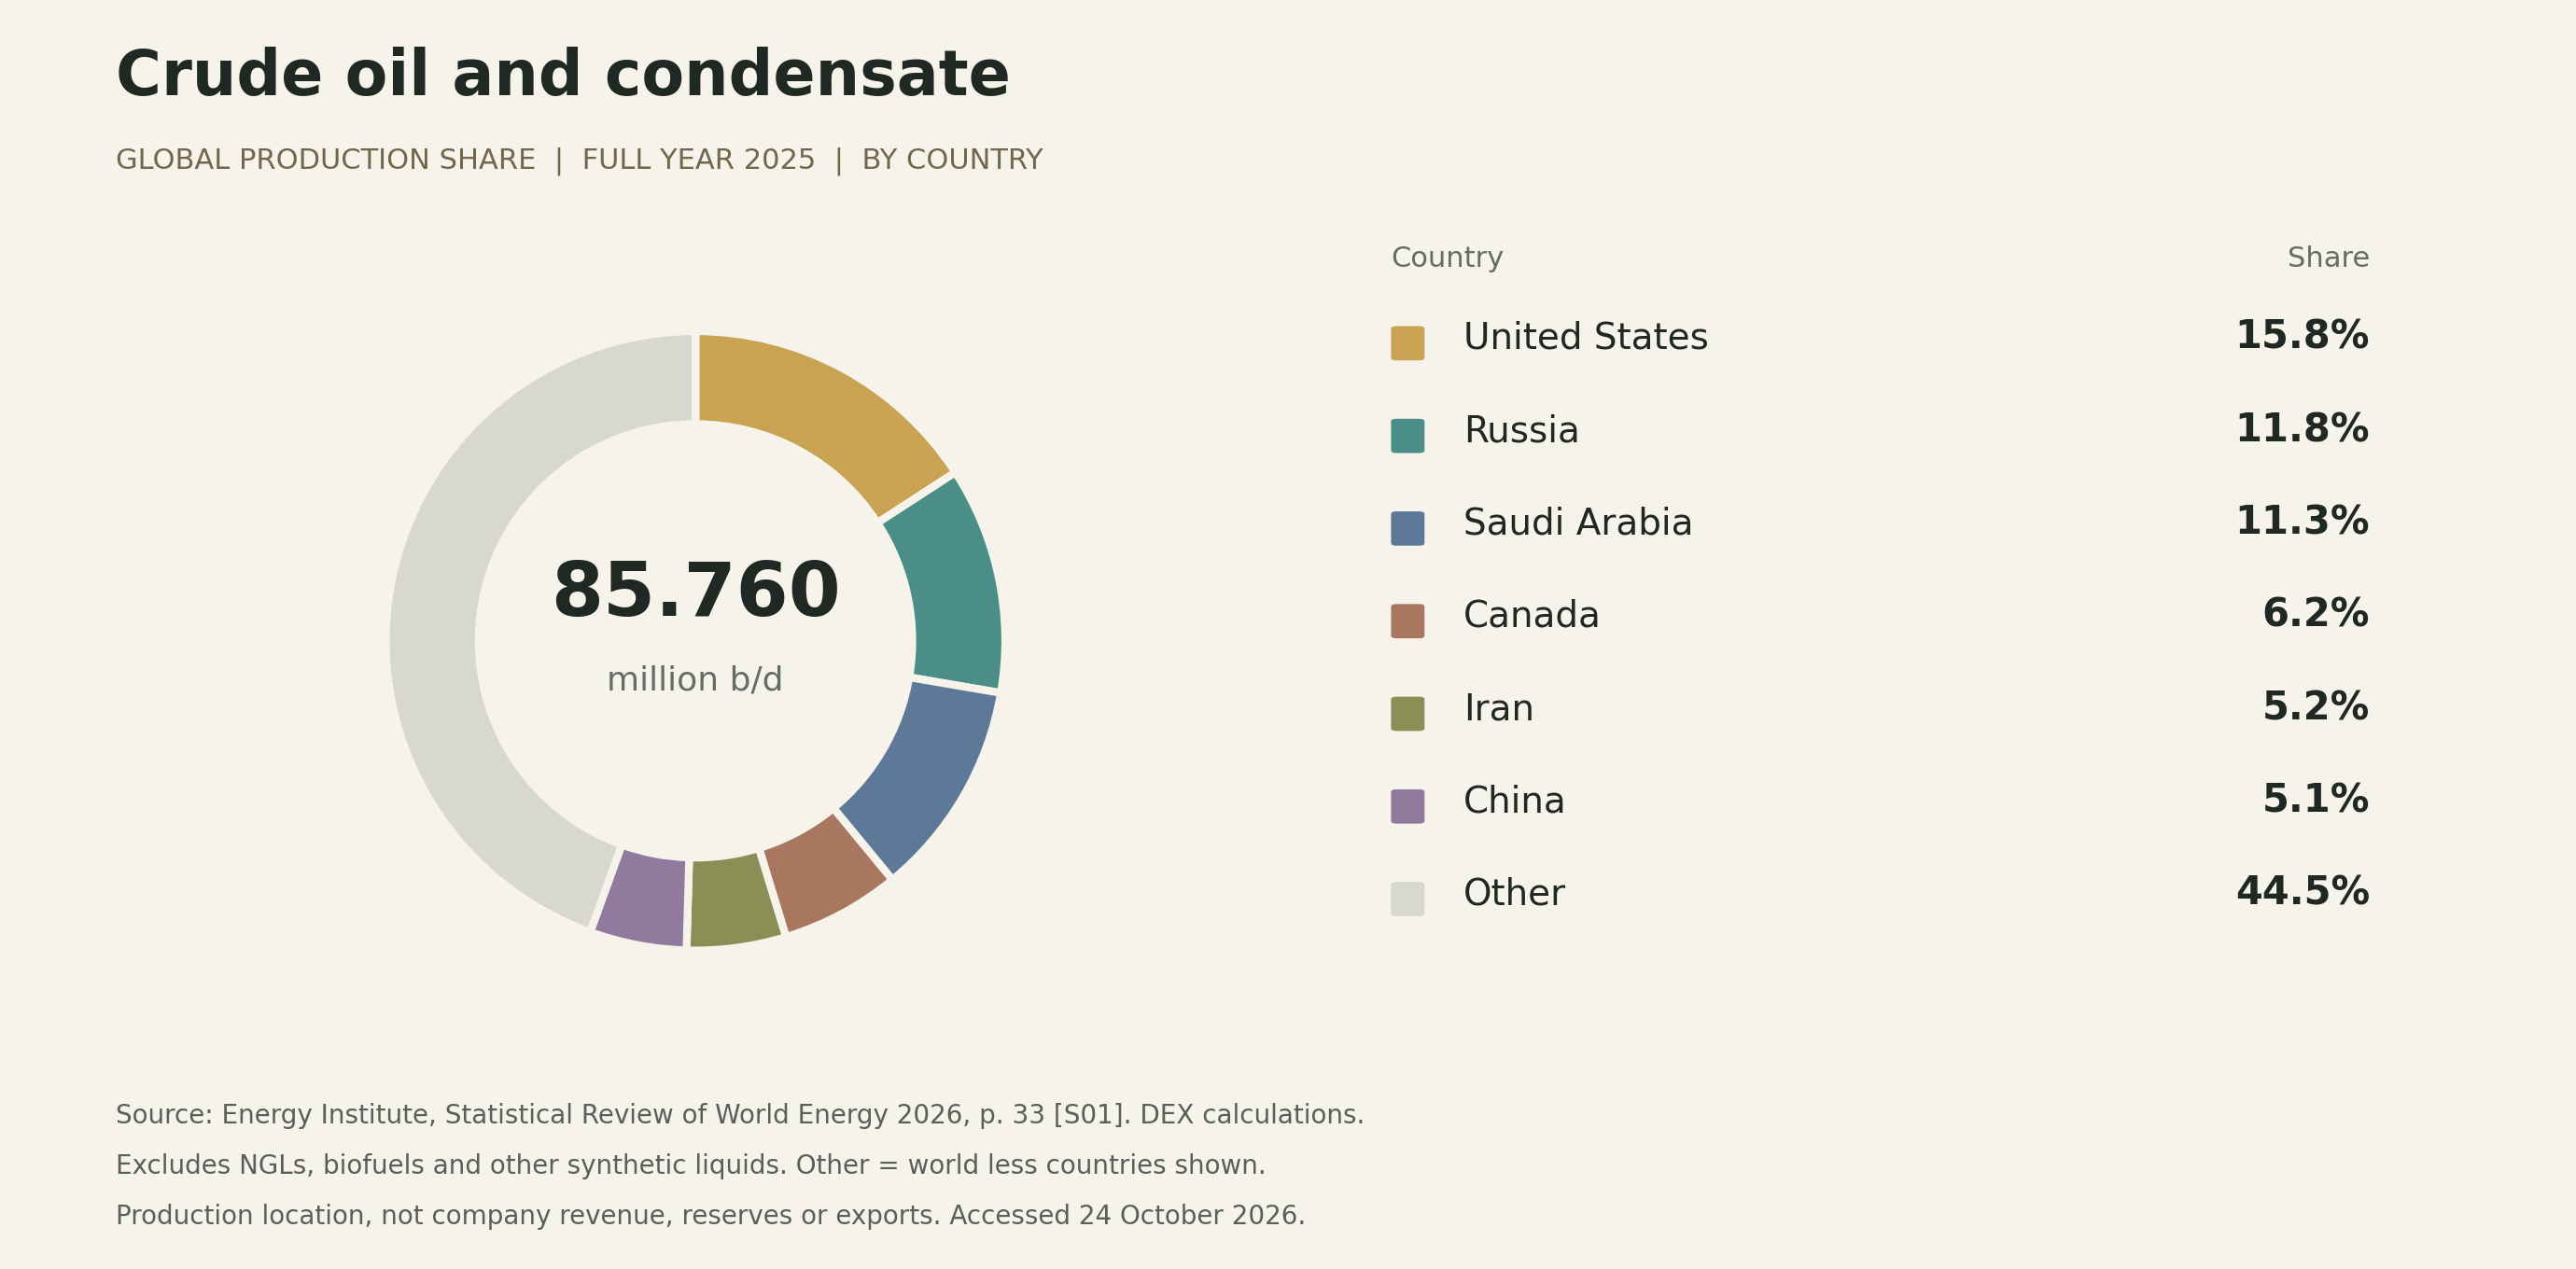
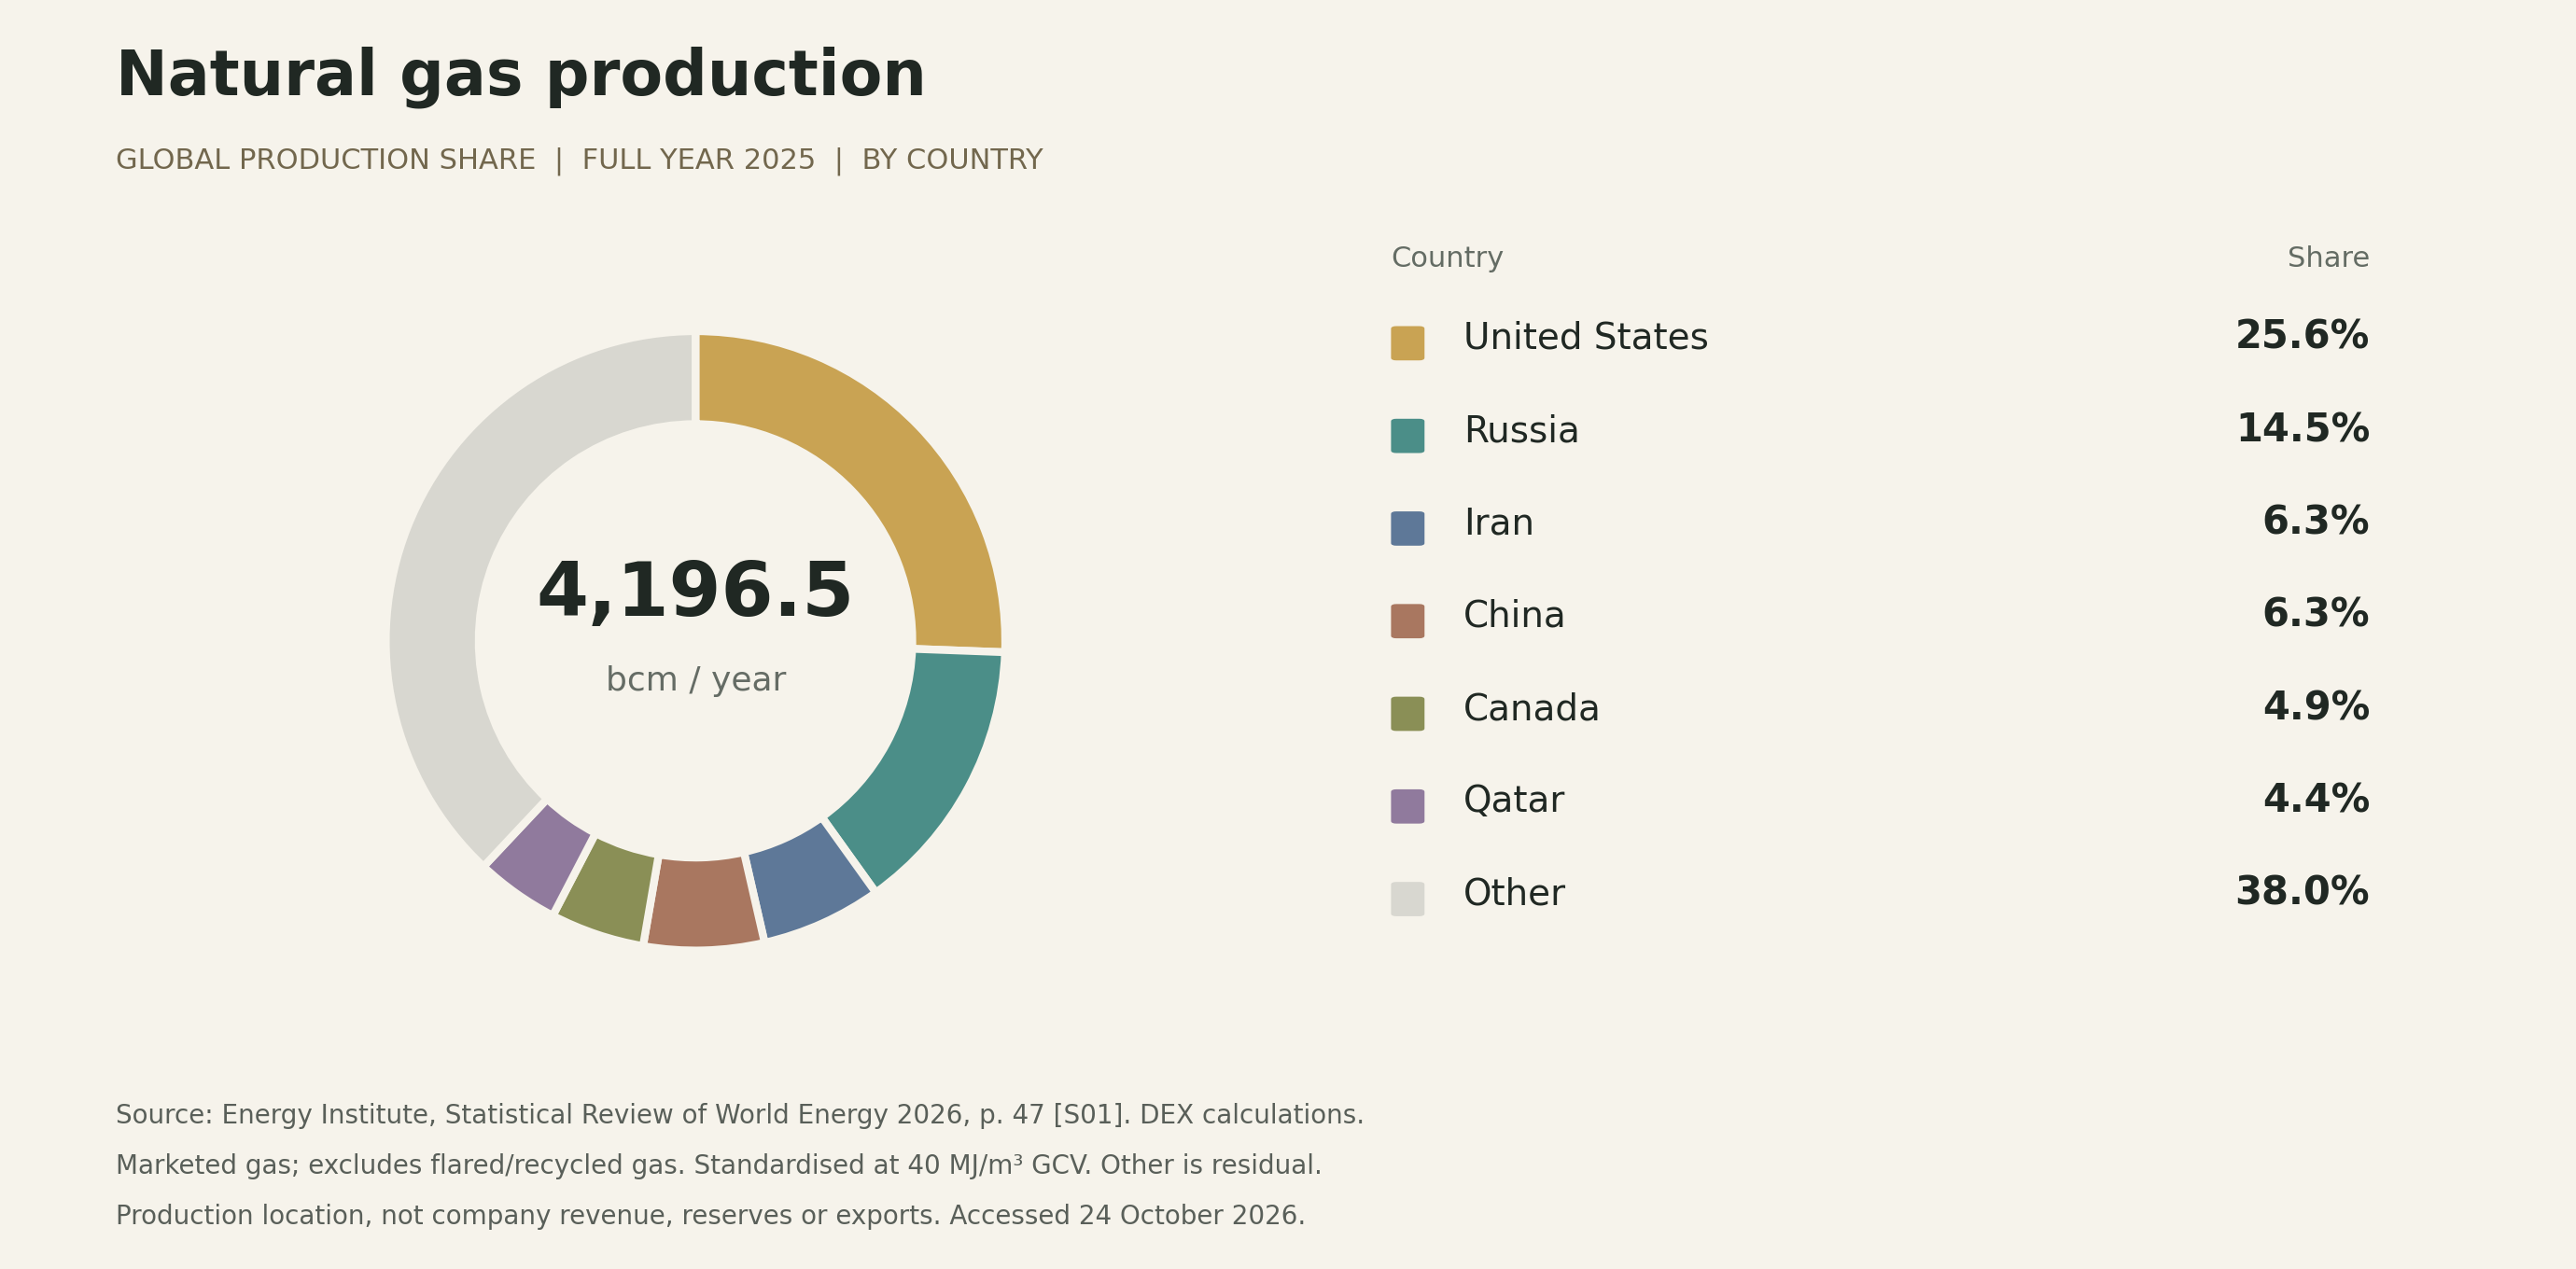
Start with physical output. Global crude and condensate production averaged 85.760 million barrels a day in 2025; annual natural gas production was 4,196.5 billion cubic metres. Each chart uses its own global denominator from the same EI edition. These are production-location shares, not corporate revenue, reserves or export shares. [S01]
Competition operates at several levels. Integrated producers combine resource portfolios, execution and financing; independent E&P firms concentrate on upstream assets and capital allocation; service companies compete on technology, reliability and delivery. National output cannot be assigned to one national oil company, and operated output must not be confused with equity output. [S02] [S06] [S07] [S08] [S09] (author’s classification)
Guyana illustrates ownership versus control. Disclosed Stabroek interests are ExxonMobil 45%, Hess 30% and CNOOC 25%. Chevron completed its Hess acquisition in July 2025, so Hess belongs within Chevron at group level; counting them as wholly separate competitors would misstate the landscape. [S02] [S05]
Investment is also heterogeneous. In May 2026, the IEA projected annual oil investment below US$500 billion and gas investment around US$330 billion. These broader supply-infrastructure categories indicate capital allocation; they are neither E&P revenue nor a pure upstream capex total. [S12]
Understanding project returns
Realised prices multiplied by saleable equity output provide a starting point for producer revenue. Operating and transport costs, fiscal payments, capital spending, finance and retirement obligations then affect cash available. Production-sharing terms require separate treatment. This is an analytical framework, not an issuer’s accounting formula.
A barrel of oil equivalent (boe) converts energy, not sales value. Lifting cost is only part of total cost: it excludes burdens that can matter to new-project economics. Gas analysis must also examine transport capacity and charges; the consumer’s bill is not the producer’s wellhead revenue. [S14] (author’s analysis)
Production composition
Full year 2025, worldwide, by country of production. Shares use published production volumes and are displayed to one decimal. Other is world output less the countries shown.
View the printable oil production chart
View the printable gas production chart
Part 4: Industry Problems
Decline and capital discipline
Existing fields decline. The IEA estimates that nearly 90% of annual upstream investment since 2019 has offset declines. This helps explain substantial spending even without fast demand growth. Workovers, additional drilling and new projects can replenish supply, but spending does not establish economic value. Examine capital required for incremental output and subsequent operating performance. [S10]
Project timing and disrupted routes
Long procurement and construction cycles constrain responses to price increases. The IEA’s 2026 investment analysis identifies supply-chain and offshore-rig constraints; its October report forecasts broader oil supply of 100.7 mb/d and demand of 102.4 mb/d for 2026. These are dated forecasts, not a linear price signal or a series comparable with EI crude output. Alternative routes, inventory and staged development offer buffers at a cost. [S11] [S12]
Methane and environmental obligations
The IEA estimates 2025 methane emissions of 45 Mt from oil and 36 Mt from gas activities. These scopes extend beyond E&P and are not wholly measured. Leak detection and repair, equipment replacement and reduced venting/flaring can help, but recovered gas still needs processing and market access. Retirement provisions belong in project design and funding, not only at the end of production. [S03] [S06] [S13]
Definitions and long-term demand
Resources, reserves, capacity, daily output and equity production answer different questions. An undefined market-size headline can obscure this. Near-term energy-security demand does not remove long-term substitution risk. The author’s view is to test lower prices, cost inflation and delays, matching demand assumptions to asset life rather than treating one high-price year as proof of durable profitability.
Monitoring priorities: comparable equity output and decline; project budgets and first-production dates; realised prices and transport differentials; sustaining versus growth capex; methane intensity and measurement coverage; and retirement cash obligations. This brief is an industry framework, not a company valuation or trading recommendation.
Appendix: Evidence and Methods
Source identifiers link claims and figures to the records below. All were accessed on 24 October 2026. Undated indicates no explicit publication date on the page. Third-party originals are linked at the publisher and are not redistributed.
[S01] Energy Institute
Statistical Review of World Energy 2026 · Published: 2026-06-30 · Accessed: 2026-10-24.
2025; printed pp. 33, 47 and 81 (PDF pp. 34, 48 and 82). Global crude/condensate and gas output and definitions. Statistical compilation, not a well-level audit or company revenue dataset. Gas is standardised at 40 MJ/m³ GCV and excludes flared/recycled gas; annual growth is leap-year adjusted.
[S02] ExxonMobil
ExxonMobil Guyana begins production at fourth offshore Guyana project · Published: 2025-08-08 · Accessed: 2026-10-24.
Event on the same date; opening, ONE GUYANA and ownership paragraphs. Supports startup, initial annual-average target of 250,000 b/d, installed capacity above 900,000 b/d at startup, and 45/30/25 interests. Company disclosure; targets and capacity are not full-year actual output.
[S03] Government of Guyana Department of Public Information
First oil achieved at Guyana’s fourth FPSO ONE GUYANA · Published: 2025-08-08 · Accessed: 2026-10-24.
Same-day event; first five body paragraphs. Government announcement corroborates first oil and SBM construction and describes licensing/decommissioning safeguards. The government is a stakeholder; this is not independent proof of returns or environmental performance.
[S04] SBM Offshore
FPSO ONE GUYANA Purchase by ExxonMobil Guyana Completed · Published: 2026-02-04 · Accessed: 2026-10-24.
Same-day event; first three paragraphs. Approximately US$2.32bn cash consideration, ownership transfer and operations/maintenance through 2035. Consideration is neither total field-development cost nor SBM annual revenue.
[S05] Chevron via US SEC
Form 8-K dated July 18 2025 · Published: 2025-07-18 · Accessed: 2026-10-24.
Same-day event; Item 8.01. Confirms completion of the Hess acquisition and wholly owned subsidiary status. Establishes ownership change, not realised synergies.
[S06] SLB
Products and services · Published: Undated · Accessed: 2026-10-24.
Product catalogue at access date; Reservoir Characterization, Well Construction, Production, and Plug and Abandonment. Supports business categories, not rankings or particular customer contracts.
[S07] Aramco
Oil production · Published: Undated · Accessed: 2026-10-24.
Business description at access date; grades and integrated upstream/downstream paragraphs. Supports production and processing-related positioning. Some page figures are dated 2023; no cost, emissions or capacity ranking is adopted.
[S08] Enbridge
Annual Letter to Shareholders 2026 About us · Published: 2026; publication day unstated · Accessed: 2026-10-24.
Liquids Pipelines, Gas Transmission and Midstream, and Gas Distribution and Storage sections. Supports transport, storage and distribution roles; throughput shares are not used as upstream production shares.
[S09] ConocoPhillips
About us · Published: Undated · Accessed: 2026-10-24.
At access date; About us text and business navigation. Supports independent E&P positioning and activities. Independent is a business classification, not absence of joint ventures or gas commercial activities; no self-reported ranking is adopted.
[S10] International Energy Agency
The Implications of Oil and Gas Field Decline Rates Executive summary · Published: 2025-09-16 · Accessed: 2026-10-24.
Opening section and no-investment scenario. Supports the estimate that nearly 90% of upstream investment since 2019 offset declines. Model and historical-sample analysis, not every company’s spending mix or an oil-price forecast.
[S11] International Energy Agency
Oil Market Report October 2026 · Published: 2026-10-14 · Accessed: 2026-10-24.
Public Highlights and Fragile rebound; 2026 forecast and September estimates. Uses 100.7 mb/d supply and 102.4 mb/d demand forecasts to frame risk. This broader oil balance differs from S01 crude/condensate; do not splice the series for growth calculations.
[S12] International Energy Agency
Impacts of Middle East conflict set to reshape energy investment plans as disruptions put focus on security · Published: 2026-05-28 · Accessed: 2026-10-24.
Oil/gas investment paragraphs; 2026 forecast. Supports oil investment below US$500bn, gas investment of US$330bn and supply-chain constraints. Broader supply infrastructure is included; these are not E&P revenue or pure upstream capex.
[S13] International Energy Agency
Global Methane Tracker 2026 Key findings · Published: 2026-05-04 · Accessed: 2026-10-24.
Opening and mitigation-policy sections; 2025 estimates. Oil 45 Mt and gas 36 Mt of methane across their activity scopes, not E&P alone. Combines measurement, satellite and inferred data; not a globally measured census.
[S14] US Energy Information Administration
Natural gas explained Natural gas prices · Published: Undated · Accessed: 2026-10-24.
Commodity cost, Transmission and distribution costs, and regional price factors. Supports separating fuel and transport costs and the effect of pipeline capacity. US explanatory material, not a single global gas price.
Calculations and definitions
Crude chart: crude, shale/tight oil, oil sands and condensates requiring further refining; excludes separately reported NGLs, biofuels and other synthetic liquids. Unit: thousand barrels/day; world denominator 85,760.
Gas chart: marketed production, excluding flared/recycled gas and including gas used for gas-to-liquids. Uses the source’s standardised volume basis; world denominator 4,196.5 bcm. One bcm is one billion cubic metres.
Share = country volume / same-table world volume × 100. Other is calculated from published volumes before share rounding. Independently rounded percentages can differ from 100% by 0.1 percentage point. Source values are already rounded; no additional precision is claimed.
The 2024–2025 gas annual-volume increase is approximately 1.29%; EI reports 1.6% on a leap-year-adjusted, daily-comparable basis. These are different measures. They are not interchanged in the body.
2026 forecasts retain their publisher, date and boundary. IEA total-oil balances are not spliced with EI crude/condensate data. No corporate-share chart is constructed from incompatible equity definitions.
Production values behind the charts
Worldwide crude oil and condensate production · 2025 · thousand barrels/day
| Country | Production | Share |
|---|---|---|
| United States | 13,586 | 15.8% |
| Russia | 10,161 | 11.8% |
| Saudi Arabia | 9,727 | 11.3% |
| Canada | 5,358 | 6.2% |
| Iran | 4,446 | 5.2% |
| China | 4,340 | 5.1% |
| Other | 38,142 | 44.5% |
World denominator: 85760. [S01]
Worldwide natural gas marketed production · 2025 · billion cubic metres/year
| Country | Production | Share |
|---|---|---|
| United States | 1,073.7 | 25.6% |
| Russia | 609.4 | 14.5% |
| Iran | 264.8 | 6.3% |
| China | 264.1 | 6.3% |
| Canada | 206.2 | 4.9% |
| Qatar | 183.5 | 4.4% |
| Other | 1,594.8 | 38.0% |
World denominator: 4196.5. [S01]
Cover photograph and permissions
The photograph shows Petrobras P-51 in Brazil. The image record and original Agência Brasil publication are dated 2 January 2009. It illustrates offshore production infrastructure and is not evidence about the Guyana project or current operating conditions.
Credit: Divulgação Petrobras / ABr. Title: Oil platform P-51 (Brazil). Image record · Original Agência Brasil publication · CC BY 3.0 BR license. The original file is retained; the site generates smaller WebP copies and crops the displayed cover. Photo provenance record.