Industry report · Version 1.1 · Global market · Public information cutoff 10 October 2026.
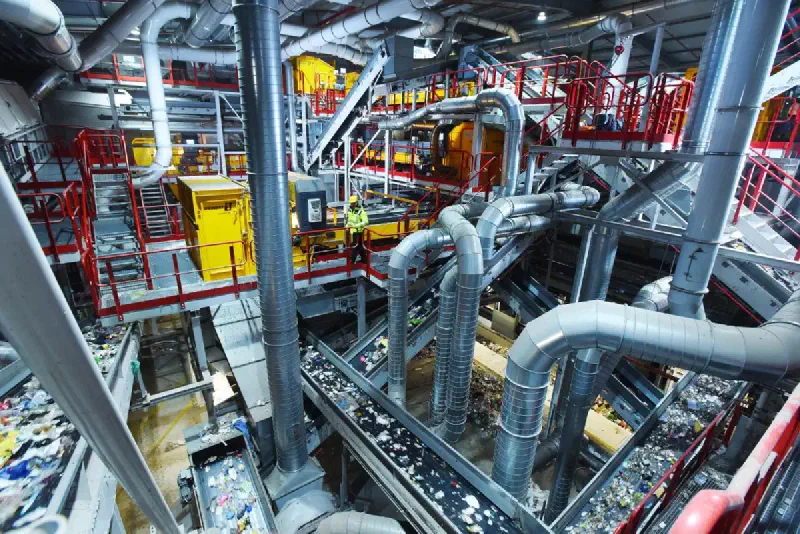
Photo: STEINERT, “STEINERT UniSort PR” · CC BY 4.0 · 29 January 2019. Original photograph unchanged; responsive web versions resized and the display may be cropped to fit. Image evidence I01.

Article text without Supporting Evidence · Complete English report with Supporting Evidence · Supporting Evidence
This report examines municipal solid waste, commercial and industrial residues, construction and demolition materials, hazardous waste, and electronic waste through the businesses that collect, treat and recover them. Agricultural residues and mining wastes are discussed where relevant to material recovery; wastewater services and primary mining are outside the core scope. Statistical boundaries vary, so the report does not present an invented aggregate for every solid-waste stream.
The central finding is that reliable collection, permitted treatment and saleable recovered outputs determine commercial value together. Service revenue can remain resilient while recycled commodity prices weaken. A large physical waste burden does not automatically become a profitable addressable market: someone must fund collection, pay for safe disposal, and purchase recovered materials.
All monetary figures retain their original currencies and accounting definitions. The company comparison uses 2025 full-year disclosures; Sims has a June financial year-end. Later public policy and statistical publications are included through the cutoff. Forecasts are identified as forecasts. The treatment-pathway chart covers municipal solid waste only; the company comparison retains each business's distinct reporting scope.
Part 1: Industry Story
On 15 August 2025, ten days of negotiations in Geneva ended without agreement on the text of a global plastics treaty. Representatives of 183 countries had attended the resumed fifth session of the Intergovernmental Negotiating Committee, known as INC-5.2. The committee adjourned and agreed to resume negotiations at a later date. This was a concrete setback in a process intended to produce an international instrument on plastic pollution. It was also a useful entry point into the waste industry: even a widely traded material can be collected, processed and sold under national systems while governments remain divided over the framework governing its full life cycle. [1]
That meeting was not the final episode. On 7 February 2026, INC-5.3 elected Chilean ambassador Julio Cordano as chair. UNEP stated that this resumed session dealt solely with organizational matters and held no substantive negotiations. This dated update establishes what happened at that meeting; it does not establish the status of every subsequent discussion through the report’s 10 October 2026 cutoff. [2]
The treaty mandate addresses the whole plastics life cycle. The analytical implication is that the economics of discarded material begins before it reaches a collection vehicle. Product design influences what can be separated; material choices influence what a processor can sell; and responsibility for financing the waste stage influences whether collection happens consistently. The Geneva event should therefore introduce a broader question: how can societies pay for safe handling while recovering materials that manufacturers actually want to use? [1]
Plastics provide the opening story, but they do not define the entire sector. This report’s analytical framework extends to organic materials, paper, metals, mineral wastes and hazardous streams, each requiring different decisions. The European Commission’s 2020 Circular Economy Action Plan illustrates the wider direction: it connects product design, waste prevention and keeping resources in use. Industry therefore combines continuing public services with secondary material markets, whose products must become useful manufacturing inputs. [8]
Part 2: Industry History
Modern waste engineering developed around practical sanitation and city operations before today’s circular economy language. In a 1940 engineering paper, Fresno public works commissioner Jean L. Vincenz described a sanitary fill service that began on 15 October 1934. His method used trenches, compaction and earth cover, while his account also examined haulage, land, operating costs and public opposition. This is an illustrative local history, not a claim about the world’s first landfill. Its lasting analytical lesson is that waste infrastructure has always depended on both technical operation and the ability to organize a service people will accept. [3]
The focus broadened from visible cleanliness to less visible contamination. The United States enacted the Resource Conservation and Recovery Act on 21 October 1976. EPA’s December announcement emphasized hazardous waste handling and disposal, groundwater contamination and the need to end open dumping. These were legal requirements, not proof that every objective was achieved on schedule. For industry analysis, the change helps explain why moving waste and controlling its environmental consequences became distinct sources of value: a disposal location alone could no longer answer the regulatory problem. [4]
Cross-border controls added another layer. The Basel Convention was adopted on 22 March 1989 and entered into force on 5 May 1992. Its notification and consent procedures established a framework for controlled movements of covered wastes. Plastic waste amendments adopted in 2019 took effect on 1 January 2021, changing the treatment of different plastic waste categories. Basel did not impose a universal prohibition on all waste trade. The structural consequence is more specific: classifying the material, identifying the destination and establishing appropriate handling became part of the transaction, alongside freight and the material’s resale value. [5]
Policy also began to distinguish the purposes of different treatment routes more explicitly. The EU’s 2008 Waste Framework Directive placed prevention and preparation for reuse ahead of recycling, followed by other recovery and disposal. Its definition of recycling excludes energy recovery. It also allowed producer responsibility measures and set conditions for materials to cease being waste. These original provisions are historical evidence, not a complete statement of EU law in 2026. They illustrate an important commercial transition: performance could be assessed through avoided waste, recovered products and responsible handling, rather than simply the quantity delivered to a facility. [6]
China’s import policy demonstrates why material channels cannot be assumed to remain fixed. A joint announcement signed on 24 November 2020 prohibited imports of solid waste from 1 January 2021 and ended the relevant import licensing process. This concerned legally classified solid waste; it should not be described as a ban on every secondary raw material. The analytical implication is that processors and exporters need alternatives to a single receiving market. A business model dependent on an enduring foreign outlet can face disruption even when its collection operation remains unchanged. [7]
The European Commission’s second Circular Economy Action Plan, adopted on 11 March 2020, placed the whole product life cycle within the policy agenda. Its measures address design, prevention and keeping used resources within the economy. As an analytical framework, this shifts attention from disposal capacity alone toward durability, reuse and demand for secondary inputs. It also creates a tension for conventional volume-based businesses: reducing waste can improve environmental outcomes while reducing the throughput from which some operators earn service fees. [8]
More recent packaging policy makes the distinction between policy announcement and operating obligations essential. Regulation (EU) 2025/40, the Packaging and Packaging Waste Regulation, entered into force on 11 February 2025, with application beginning on 12 August 2026. The Commission’s August 2026 explanation describes phased implementation, with important recyclability and recycled plastic content measures applying from 2030. This is an EU packaging example, not a global rule for all solid waste. Its significance is that product requirements and recovery investments increasingly interact, but they do so across different dates, with adjustment costs before every intended benefit can materialize. [13]
Part 3 Market Landscape
The industry connects two customers. One pays to have an unwanted material managed safely; another may pay for a recovered material or energy product. Sometimes the same operator serves both, but the revenue streams have different risks. This section separates their roles before comparing scale, processing routes and companies.
The upstream chain
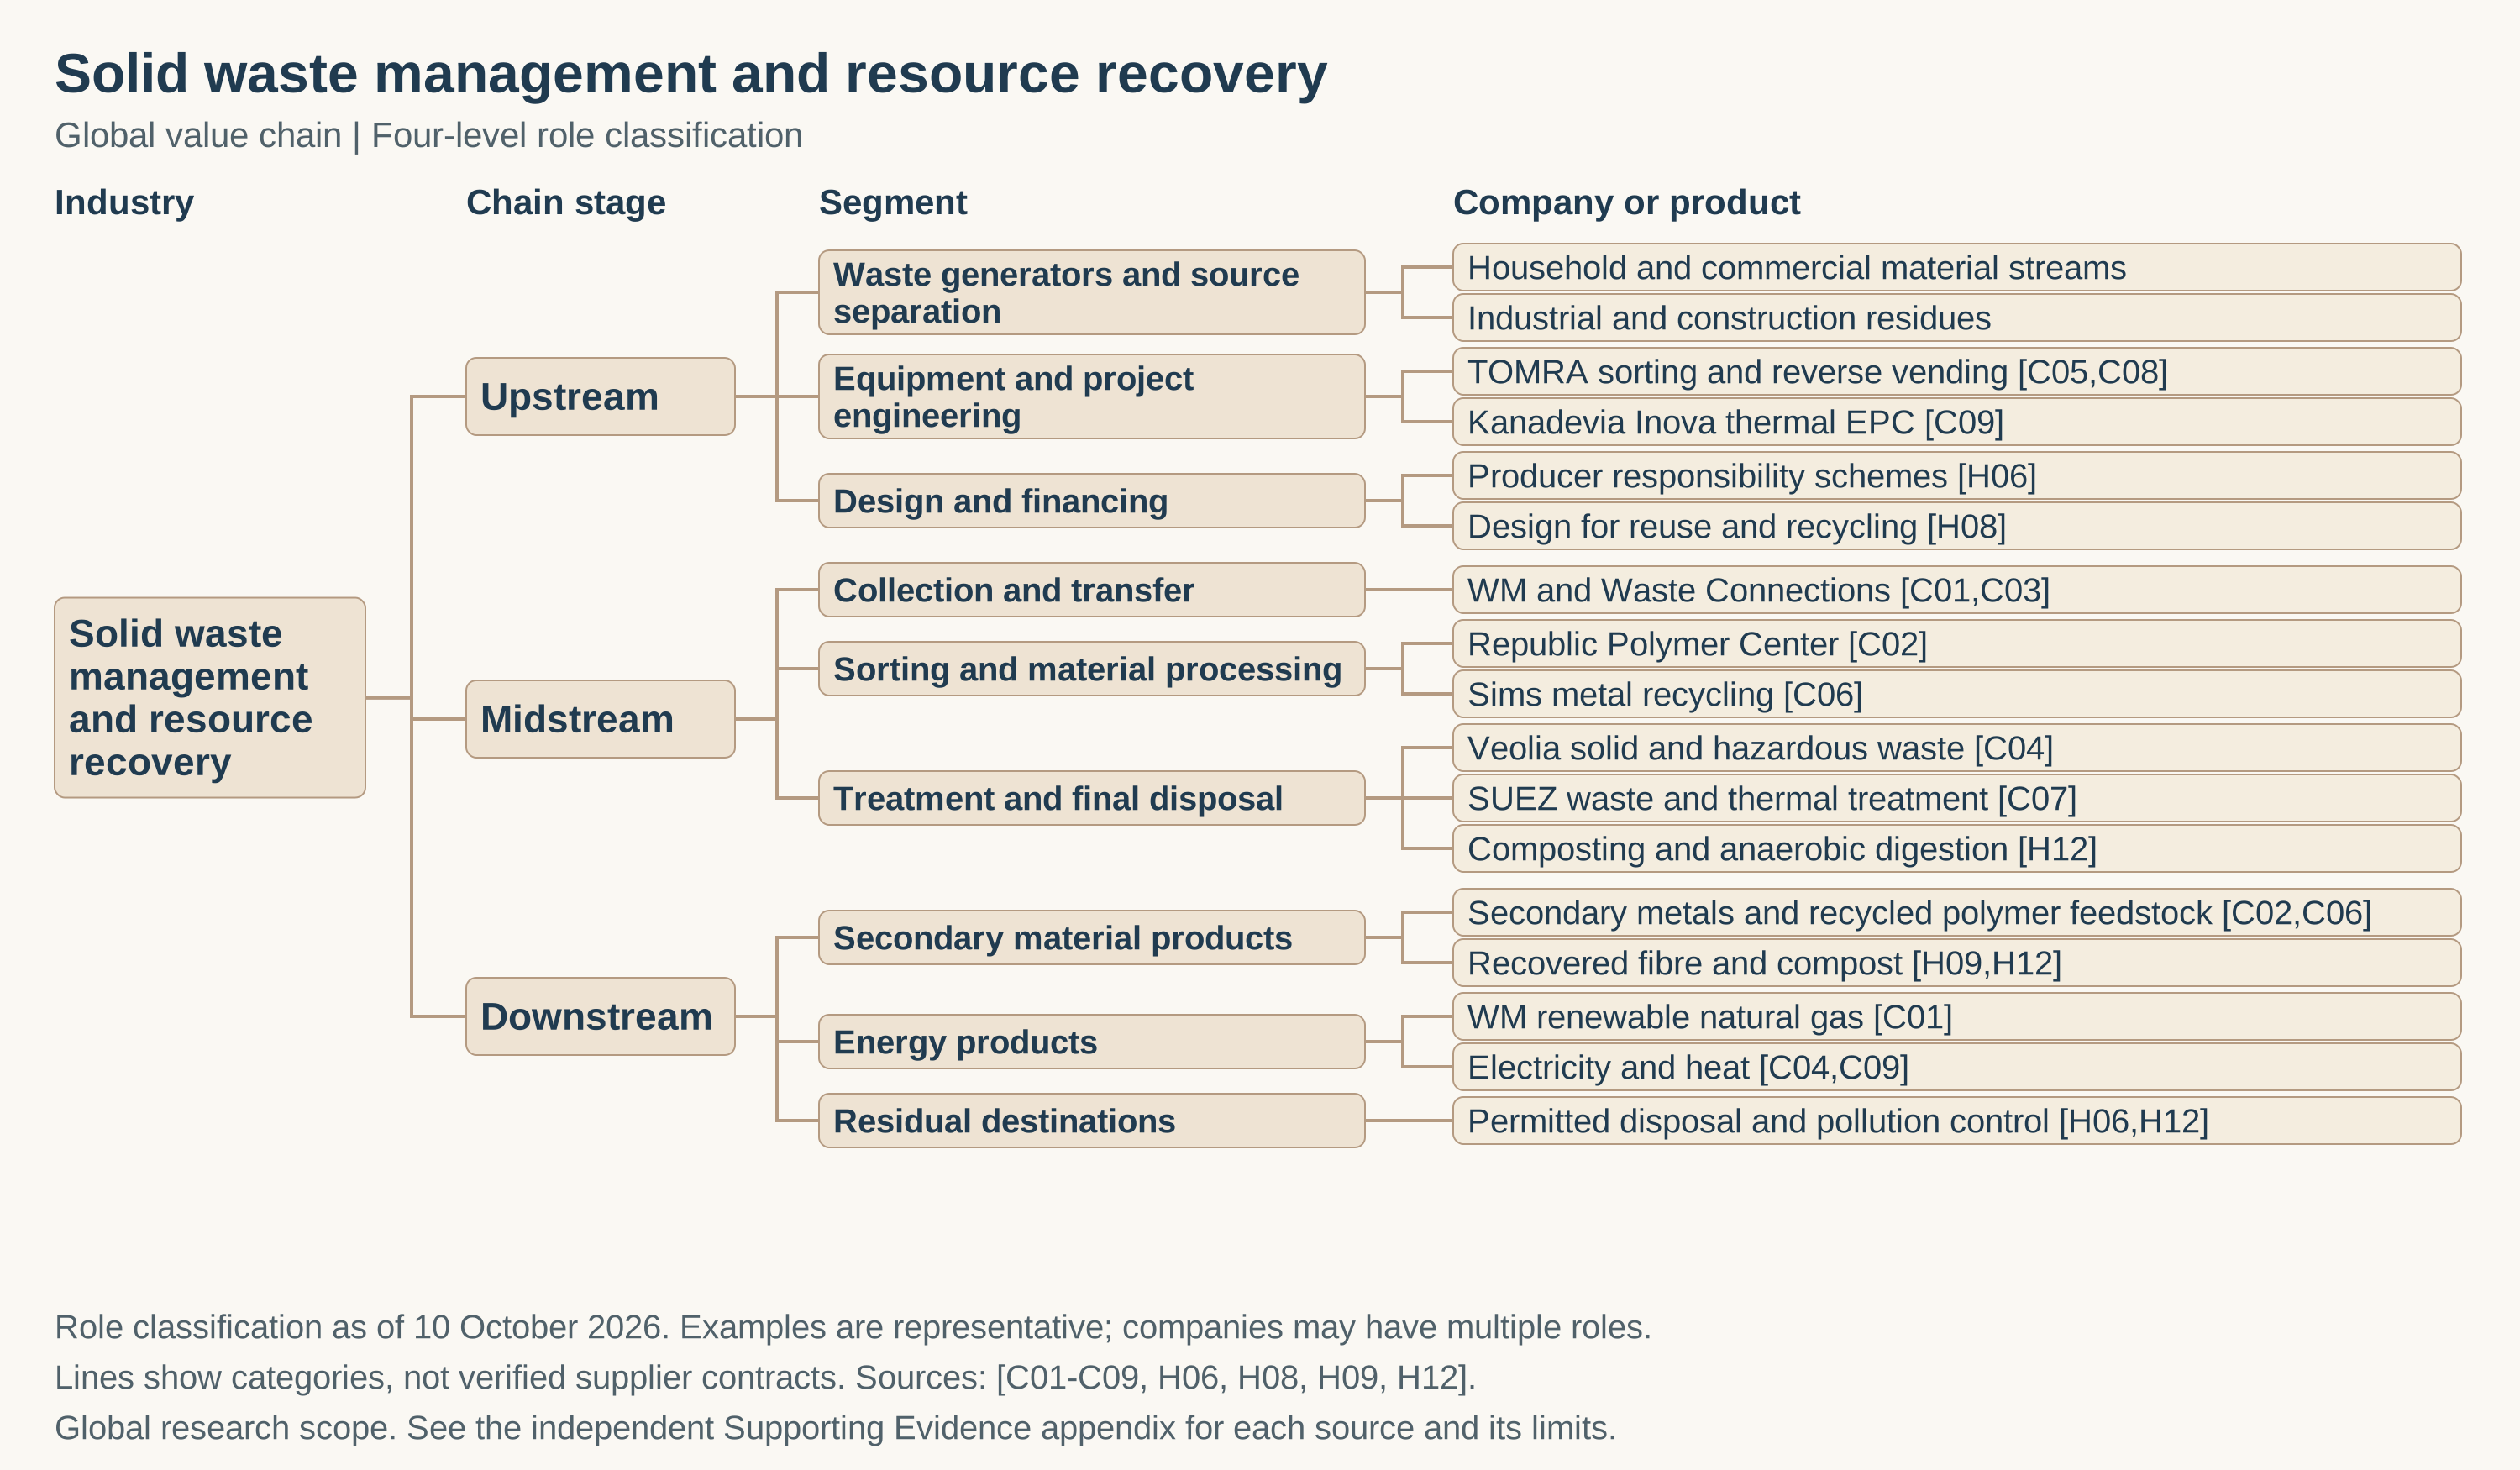
Upstream begins with households, businesses, manufacturers and construction sites that generate discarded materials. Collection contracts, source separation and material specifications decide what arrives at a plant. For analytical purposes, a producer's payment under an extended producer responsibility scheme belongs to the financing layer, rather than to the physical tonnage of recycling. Product design also affects how readily materials can be sorted and reused. [6][8]
Equipment and engineering suppliers form another upstream branch. TOMRA supplies sensor-based sorting and reverse vending technology. Kanadevia Inova provides thermal-treatment engineering: its Schwandorf contract covers combustion, boilers and flue-gas treatment. These are equipment and project businesses selling capability to operators, rather than simply receiving a disposal fee for every tonne of waste. Supplier descriptions establish these roles, without proving a uniform recovery yield or investment return. [29][32][33]
The midstream chain
Midstream includes collection, transfer, sorting, processing and compliant residual disposal. Integrated operators such as WM and Waste Connections participate in several stages. Veolia's waste activities distinguish solid waste from hazardous waste, while Republic Services combines recycling and waste operations with environmental solutions. Classification links in the industry map describe these roles; they do not represent proven supplier contracts. [25][26][27][28]
Sorting separates material streams; subsequent processes depend on their composition. Paper, metals and selected plastics enter material recovery; separately collected organics can enter composting or anaerobic digestion; residual material can go to permitted thermal treatment or landfill. Hazardous waste needs its own identification, handling and final-treatment controls. The appropriate route depends on the material and applicable controls, rather than on a single global technology ranking. [6][10][12]
Metal recovery illustrates a distinct purchasing business. Sims collects, processes and trades ferrous and non-ferrous scrap and provides IT reuse and recycling services. An operator that buys scrap must cover the purchase price, processing and freight through subsequent sales. Large sales revenue therefore does not by itself demonstrate a large service margin. Its 50% interest in SA Recycling is equity-accounted and must not be treated as fully consolidated sales. [30]
The downstream chain
Downstream consists of recovered material customers, energy purchasers and the destination of remaining residues. The products include secondary metals, recycled polymer feedstock, recovered fibre, compost and energy, subject to their respective quality and regulatory requirements. Sims' disclosed metal-trading activities and Republic's operational Indianapolis Polymer Center illustrate two distinct material routes. WM also develops renewable natural gas capacity. [25][26][30]
The industrial analysis is straightforward: recovery creates commercial value only when the output meets an actual buyer's specification at an acceptable delivered cost. Mixed collection, unwanted additives or an unsuitable product grade can leave a technically recovered output without an adequate market. Preventing contamination and agreeing offtake terms address different sides of this problem. [9]
INDUSTRY MAP · GLOBAL
Global solid waste management and resource recovery value chain
Four-level classification map connecting the industry to upstream, midstream and downstream branches, then activities and representative companies or products.
Read the full text outline
- Solid waste management and resource recovery
- Upstream
- Waste generators and source separation
- Household and commercial material streams
- Industrial and construction residues
- Equipment and project engineering
- TOMRA sorting and reverse vending
- Kanadevia Inova thermal EPC
- Design and financing
- Producer responsibility schemes
- Design for reuse and recycling
- Waste generators and source separation
- Midstream
- Collection and transfer
- WM and Waste Connections
- Sorting and material processing
- Republic Polymer Center
- Sims metal recycling
- Treatment and final disposal
- Veolia solid and hazardous waste
- SUEZ waste and thermal treatment
- Composting and anaerobic digestion
- Collection and transfer
- Downstream
- Secondary material products
- Secondary metals and recycled polymer feedstock
- Recovered fibre and compost
- Energy products
- WM renewable natural gas
- Electricity and heat
- Residual destinations
- Permitted disposal and pollution control
- Secondary material products
- Upstream
Role classification as of 10 October 2026. Company names are examples; lines do not establish supply contracts. Companies may appear in more than one role.
Sources: C01 · Waste Management Inc · C02 · Republic Services Inc · C03 · Waste Connections Inc · C04 · Veolia Environnement · C05 · TOMRA Systems ASA · C06 · Sims Limited · C07 · SUEZ · C08 · TOMRA · C09 · Kanadevia Inova · H06 · European Parliament and Council of the European Union · H08 · European Commission, Directorate-General for Environment · H09 · Organisation for Economic Co-operation and Development (OECD) · H12 · United Nations Environment Programme; International Solid Waste Association (ISWA). Reviewed 2026-10-10.
Role classification as of 10 October 2026. Company names are examples; lines do not establish supply contracts. Companies may appear in more than one role. Sources[25][26][27][28][29][30][31][32][33][6][8][9][12].
Physical scale and the limits of a global market total
The World Bank's What a Waste 3.0 estimates global municipal solid waste generation at 2,562 million tonnes in its modeled 2022 baseline and projects 3,855 million tonnes in 2050 under business as usual. The implied increase is approximately 50.5%, calculated from these published endpoints; it is a scenario for physical waste, rather than a revenue forecast. Revised coverage and methods prevent a clean growth comparison with older global reports. [14][15]
Other streams show why municipal waste cannot stand for the whole industry. ITU and UNITAR estimate 62 million tonnes of global electronic waste in 2022, with 22.3% documented as formally collected and recycled. That measure does not equal the final yield of recovered metals. China's 2025 bulletin reports preliminary national general industrial solid waste generation of 4,410 million tonnes. The exact 2025 survey coverage was not verified, so the report does not assume the same enterprise boundary as earlier industrial surveys. These streams may overlap with other classifications and are not added to the municipal total. [34][18]
For a broader historical example, Eurostat records 1,992 million tonnes of waste treated in the EU in 2022, including industrial and mineral streams. Its 61.4% recovery category includes recycling, backfilling and energy recovery. Treatment and generation also differ because of trade. This figure cannot be compared directly with a municipal recycling rate. [35]
No single verified global revenue denominator in this evidence set covers collection services, hazardous treatment, recovered commodity trading and equipment on a consistent basis. Adding their sales can also count the same material at several transactions. UNEP's estimated direct management cost of US$252.3 billion for municipal solid waste in 2020 is a cost-model result, not the commercial revenue or addressable market of the entire industry. [12]
Construction and mineral waste
Construction materials create a separate recovery market. EPA estimated 600.330 million US short tons of construction and demolition debris in 2018, including buildings, roads and bridges, separately from municipal waste. Of this, 313.070 million short tons were assigned to aggregate next use and 131.590 million to manufactured products. Its next-use categories also include fuel, so they cannot all be called material recycling. These are historical US estimates, not a global total or current revenue forecast. [20]
Eurostat recorded 2,233 million tonnes of waste generated in the EU in 2022: construction accounted for 38.4% and mining and quarrying for 22.7%. This regulatory all-waste scope is broader than dry solid waste and includes substantial mineral streams. Our commercial interpretation is that bulk mineral recovery needs a different appraisal from high-value metal recovery: product specifications, haulage and a nearby receiving market should be examined before a large tonnage is treated as a valuable opportunity. The regional figures cannot be added to the global municipal baseline. [19]
The global municipal waste processing mix
Shares of global municipal solid waste generated by mass; World Bank's modeled 2022 baseline. National observations are harmonized and weighted by 2022 waste generation. Published integer percentages sum to 100%. This chart is not company market share or a breakdown of all solid-waste streams.
Use the seven original published percentages directly. 17+15+6+20+17+12+13=100. No normalization, midpoint substitution, or reverse calculation of absolute tonnes.
2022 baseline modeled/weighted aggregate. National treatment observations can come from differing years, predominantly 2020-24. Shares are weighted by 2022 waste generation. Original country and city data are adjusted for missing flows including uncollected waste, informal-sector collection and nonhousehold MSW. See section 1.2, printed pages 5-7, and Appendix C.
Use the report's seven categories as published. Uncollected waste remains a distinct category; do not add self-managed uncollected burning, dumping, recycling or composting as additional slices.
No separate unknown slice is published in Figure 2.16. This does not imply every physical flow was measured: World Bank notes conservative model adjustments may still leave unrecorded flows.
Original Figure 2.16 says Incineration. Section 1.2 printed p. 5 / PDF p. 41 expressly defines all incineration references in the report as incineration with energy recovery. Recycling is separately classified from composting and anaerobic digestion; no unsupported reuse expansion.
Source: Cook, Ionkova, Bhada-Tata, Yadav and van Woerden (2026), What a Waste 3.0, World Bank, Figure 2.16, printed page 29, PDF page 65 [15]
Adapted from World Bank data under CC BY 3.0 IGO. The views and interpretations in the adaptation are the report authors’ and are not endorsed by the World Bank.
Download editable SVG · Download original data (CSV)
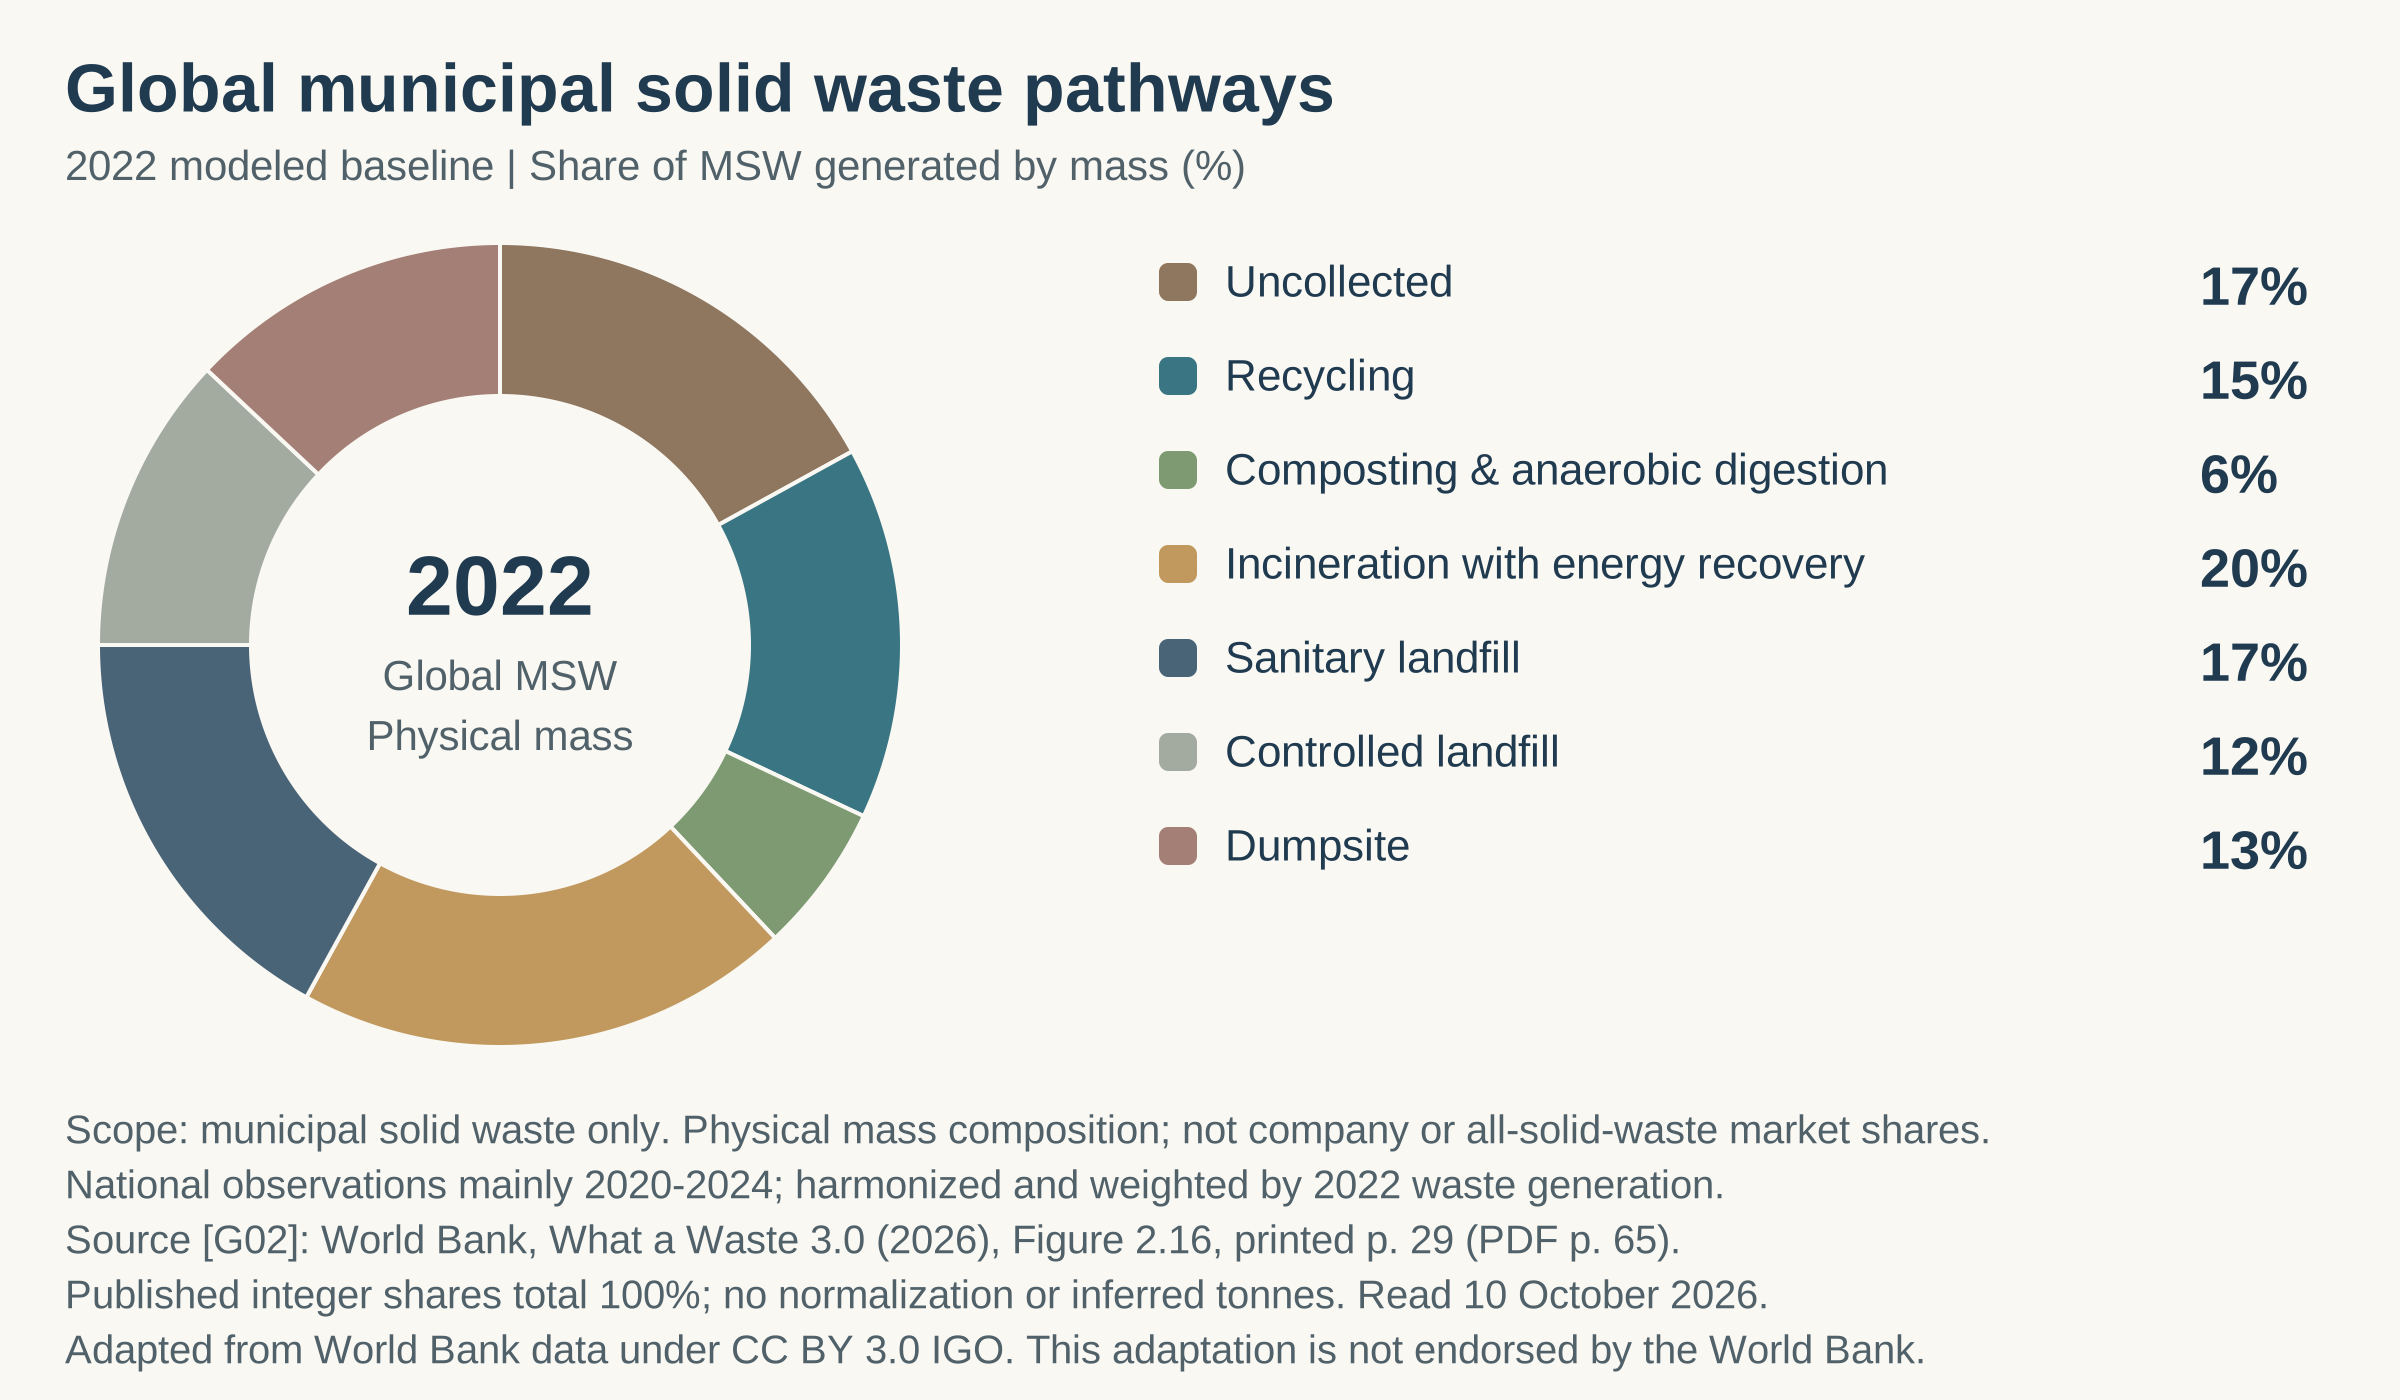
The seven published shares are uncollected 17%, recycling 15%, composting and anaerobic digestion 6%, incineration with energy recovery 20%, sanitary landfill 17%, controlled landfill 12%, and dumpsites 13%. Their sum is 100%, using the source's integer percentages without normalization or inferred decimal precision. The World Bank defines references to incineration in this report as incineration with energy recovery. [15]
This is a harmonized, mass-weighted 2022 baseline, built from country observations that predominantly cover 2020–2024 and adjusted for missing flows. It is not a simultaneous 2022 census of every plant. Uncollected waste is a separate category; adding self-managed burning or dumping as new slices would count some flows twice. Neither the recycling slice nor the composting-and-digestion slice should be interpreted as a yield of saleable material. [15]
The commercial implication is an analytical judgment: spending opportunities differ between an unserved collection area and a mature market upgrading material quality. The chart shows the physical system's structure, without allocating revenue to companies or including every industrial waste stream.
Regional differences
The EU's 2024 municipal statistics show 517 kilograms generated per person and a 48.1% recycling rate. This describes municipal waste, including the source's recycling categories, rather than all EU waste or the share of particular operators. In the US, the EPA national material-flow series still reports 2018 municipal generation of 292.4 million US short tons and recycling plus composting of 32.1%. The years and measurement systems differ, so these are separate reference points rather than a current league table. [16][17]
China's latest verified 2025 bulletin reports 264.8213 million tonnes of urban household waste collected, rather than nationwide urban-and-rural waste generation. Its preliminary national general industrial solid waste figures are 4,410 million tonnes generated, 2,650 million tonnes comprehensively utilized and 820 million tonnes disposed. Utilization and disposal may include previous inventories, so their sum is not a closed mass balance of that year's generation. The indicators have distinct coverage and cannot determine Asia's or the world's market shares. [18]
Global e-waste data also show a collection gap: documented formal collection and recycling reached 42.8% in Europe in 2022, while Africa was below 1%. The statistics establish a difference in recorded systems, without proving that all unrecorded material was unrecovered. More complete collection records and safe treatment can both be necessary. [34]
The operating implications are the author's synthesis. Regions with established services can focus on product quality, route productivity and existing-asset upgrades. Under-served markets first need dependable collection, operating budgets and suitable final destinations. Neither geography guarantees profitability: payment reliability, enforcement and local material demand remain decisive.
Representative companies and accounting boundaries
| Company and role | Reported revenue and period | Reported profit measure | Scope limitation |
|---|---|---|---|
| WM integrated operator [25] | US$25.204bn calendar 2025 | Adjusted operating EBITDA margin 30.1% | Includes healthcare solutions; legacy revenue US$22.696bn |
| Republic Services integrated operator [26] | US$16.591bn calendar 2025 | Adjusted EBITDA US$5.307bn;32.0% margin | Includes environmental solutions |
| Waste Connections integrated operator [27] | US$9.467bn calendar 2025 | Adjusted EBITDA US$3.125bn;33.0% margin | US/Canada network; acquisition effects |
| Veolia waste activity [28] | EUR15.443bn calendar 2025 | Waste EBITDA EUR2.252bn;14.6% margin | Waste only; group water/energy excluded |
| TOMRA equipment supplier [29] | EUR1.32bn calendar 2025 | Group EBITA margin 13% | Includes Food division; not waste-only |
| Sims materials recycler [30] | A$7.4940bn sales FY ended 30 June 2025 | Statutory net loss A$19.0m | Sales from continuing operations; net loss includes discontinued operations |
| SUEZ water and waste group [31] | EUR9.520bn calendar 2025 | Group EBITDA EUR1.539bn | Includes water; not a waste-only sales figure |
These firms are examples across business models rather than a ranked global-share table. WM, Republic Services and Waste Connections disclose predominantly North American service networks. Veolia's waste division is separated from its water and energy activities; SUEZ's group reporting includes water and cannot be converted into a precise consolidated waste-only revenue by combining rounded segment percentages. TOMRA also includes food sorting. [25][26][27][28][29][31]
The reported profit measures are deliberately retained: adjusted EBITDA for the three North American operators, company-defined EBITDA for Veolia's waste activity and SUEZ's group, EBITA for TOMRA, and statutory net loss for Sims. EBITDA measures can differ between companies and omit capital consumption and financing costs; an EBITA margin or net result cannot be ranked against an EBITDA margin as though they measured the same thing. The table's differing revenue scopes reinforce that limitation.
How operators earn money
The first model sells collection and compliant handling. Its economics depend on service price, customer retention, route density, transport distances and the cost of the receiving facility. The second sells processing capacity, often with a fee per tonne and sometimes a longer concession or operation contract. The third sells recovered commodities, with purchase cost, grade, yield and freight determining the spread. Equipment vendors instead receive project, equipment and service revenue. This classification is an analytical framework based on the disclosed businesses.
Price and physical volume can move differently. WM reported 2025 collection-and-disposal core price of 6.3% and volume of 0.1% on its own definitions. Waste Connections' reported revenue rose from US$8.920 billion to US$9.467 billion, while acquisitions and divestitures affected the comparison. These disclosures caution against reading revenue growth as a measure of growing waste generation. [25][27]
Contract announcements also require boundaries. Veolia reported UK waste contracts won or extended with cumulative backlog above GBP1 billion. That is not one year's recognized revenue. Schwandorf's two replacement lines are designed for approximately 350,000 tonnes annually in combination, but the contract announcement does not establish their realized throughput or disclose a contract value. [28][33]
The same distinction applies to commodity recovery. WM's reported single-stream commodity basket averaged US$75 per ton in 2025 versus US$92 in 2024. Republic's own recycled commodity basket averaged US$135 per ton, down US$29. The baskets are different and their price levels are not compared; each within-company movement shows that operating revenue can face commodity pressure even when collection tariffs improve. [25][26]
What evidence would demonstrate durable performance
An analyst should follow the full mass balance from material generated, to collected, to accepted at a facility, to saleable output and residual destination. Those stages should share a defined reporting period and compatible units. Capacity, incoming tonnage and successful material recovery are three different measures. Contracts should identify volume obligations, specification risks, price adjustment and who pays when material is rejected.
A useful operating evaluation then connects this mass balance to cash: fees collected, output proceeds, purchased feedstock, labour and energy, transport, rejected residues, maintenance, and closure obligations. This is the author's evaluation framework, not a universally disclosed industry accounting metric. It makes the central tradeoff visible: more tonnes can increase a plant's utilization while simultaneously lowering its average material quality or increasing the cost of final disposal.
Part 4: Industry Challenges
The first challenge is financing a continuing service. UNEP and ISWA estimated global municipal waste management’s direct cost at US$252.3 billion in 2020; their broader model reached US$361 billion after external impacts and recycling gains. Neither number is industry revenue. The report also warns that financing facilities without providing for continuing collection and operation can produce failure. Our assessment therefore asks who pays the recurring bill, how reliably fees are collected and whether maintenance remains funded after construction. Funding a plant can add capacity without ensuring that usable material reaches it. Practical responses include explicit operating budgets, payment arrangements and service performance measures, although these cannot create payment capacity where it is absent. The same system assessment should include informal waste workers, whose contribution UNEP identifies as undervalued. Mechanization and formalization should be judged partly by their effect on workers’ income, safety and participation, alongside physical throughput; designing that transition does not remove the need to fund the service itself. [12]
Organic waste creates a climate problem that cannot be measured only through disposal tonnage. UNEP and the Climate and Clean Air Coalition’s 2021 assessment attributed about 20% of global human-caused methane to landfills and wastewater together. That boundary is broader than this report’s solid waste sector. The assessment identifies source separation, diverting organic material and collecting or flaring landfill gas among mitigation approaches. For project appraisal, the relevant question is how much methane is actually prevented or captured during operation. Our analysis would compare separation costs, operating requirements and usable energy output, while checking whether gas recovery can be maintained. A theoretical resource estimate is not a sales forecast. These measures address different stages of the system, so their effectiveness depends on the material entering the facility and the continuing ability to operate it. [10]
Recycling faces connected technical and commercial limits. OECD estimated that only 9% of global plastic waste was ultimately recycled in 2019, after process losses. This is a plastics result, not a current recycling rate for all solid waste. Its analysis explains that mechanical recycling can degrade material quality and that secondary plastics prices are influenced by primary plastics, while collection, sorting and processing still have to be paid for. The commercial problem is therefore not solved by increasing intake alone. A recycler needs enough saleable output at an acceptable specification and price. OECD identifies recycled content standards, producer responsibility and design measures as ways to strengthen demand or supply. Our assessment would pair these with buyer specifications and contracts rather than assume that an incentive guarantees profitable output. Cleaner inputs and better separation can help, but the economics remains sensitive to quality, yield and competing material prices. Collected material, processed material and products sold should consequently be reported separately: each measures a different stage, and losses between them determine how much of a nominal recovery opportunity becomes an actual product. [9]
Hazardous waste adds a different cost mechanism: identifying and controlling risk. EPA’s 1976 RCRA announcement emphasized standards for handling, transport and ultimate disposal, as well as contamination from inadequately controlled land disposal. For this report, that history supports an appraisal based on material characterization and the treatment process rather than weight alone. Sampling, suitable handling and documented responsibility add expense, but omitting them can leave the original problem unresolved. Our analytical recommendation is to examine those costs explicitly. A lower treatment quotation cannot establish equivalent environmental performance or show that later remediation costs have disappeared. [4]
Treatment routes also serve different objectives. Under the EU’s 2008 framework, energy recovery is excluded from recycling, while the waste hierarchy allows justified departures based on life-cycle outcomes. Our analysis therefore evaluates a facility against its intended function instead of treating every recovered unit of energy as a recovered unit of material. Material recovery, energy recovery and safe disposal require distinct performance measures. Selecting a route should account for what is displaced, what remains and whether the operation meets its purpose; no single label establishes the best result for every waste stream. [6]
Recent trade figures show why destination monitoring remains necessary. OECD’s Monitoring trade in plastic waste and scrap 2026 was published on 9 October 2026, one day before this report’s cutoff, but its latest statistics cover 2024. It found that OECD exports to non-OECD destinations rose by 0.21 million tonnes, or 15%, from 2023. These are reported trade flows, not verified recovery outcomes. The paper explicitly notes that customs data cannot identify ultimate treatment or reliably distinguish transit destinations from final importers. Our analytical response is to examine the receiving operation and evidence of completion alongside the shipment record. This adds verification costs and may narrow available outlets, but a border crossing alone cannot establish either successful recycling or illegal disposal. [11]
Basel’s procedures reinforce that distinction. For covered movements, notification, written consent and arrangements for environmentally sound management are part of the control framework. The quality and classification of plastic waste also affect its treatment under the convention. Our analysis treats documentation and material quality as transaction requirements, rather than an administrative task to complete after arranging a sale. Improving separation and identifying appropriate receiving facilities can help preserve legitimate trade. Their limitation is that compliant documents alone do not measure an operator’s actual performance; oversight must continue through the transaction. [5]
Policy can improve demand while introducing a timing problem. The Commission’s 2026 PPWR explanation distinguishes the start of application in August 2026 from later measures, including important requirements scheduled for 2030. For investors, our analytical implication is to match capacity expansion to the relevant product category and obligation date. Expected regulatory demand is not present contracted demand. Earlier investment may support preparation, but it can also leave equipment underused if customers, specifications or implementing measures develop differently. A phased plan provides time for adaptation; it does not remove financing and execution risk. [13]
Facilities must also fit their locality. Vincenz’s historical engineering account already discussed transport, land and operating conditions rather than presenting disposal technology as independent of place. Our assessment carries that practical question into project selection: what material will arrive, over what distance and with which operating resources? Choosing equipment first and assuming the supply system will follow reverses the dependency. Local measurements and service planning can improve the decision, but historical experience cannot provide a modern plant’s safety standard, cost estimate or guaranteed performance. Those require evidence specific to the proposed operation. [3]
Prevention creates an incentive question. The Commission’s circular economy agenda seeks to avoid waste and keep resources in use. Our analysis asks whether contracts reward that outcome: a payment structure based solely on tonnes handled can favor throughput even when the public objective is to reduce it. [8]
Finally, global negotiations and national obligations evolve on different tracks. UNEP’s February 2026 session addressed organization without substantive talks, while China’s solid waste import prohibition had already applied from January 2021. Neither event establishes a uniform global operating framework. Our analysis therefore treats policy monitoring as a continuing business task: operators need to distinguish a negotiating mandate, an adopted rule and an applicable obligation. Developing alternative outlets and allowing for changing requirements can improve resilience, but waiting for international agreement does not suspend existing national responsibilities or resolve immediate operating costs. [2][7]
Supporting Evidence
These 35 research materials support the report’s claims within the boundaries recorded below. Original materials are linked at their publishers and are not redistributed here. The separate photograph record I01 documents image provenance rather than industry statistics.
No matching research sources. Try another word or clear the search.
[1]Talks on global plastic pollution treaty adjourn without consensusH01 · United Nations Environment Programme (UNEP) · 2025-08-15
- Publisher
- United Nations Environment Programme (UNEP)
- Published
- 2025-08-15
- Event
- INC-5.2 adjourned 2025-08-15; 183 countries represented
- Reporting period
- INC-5.2 meeting in August 2025; no industry statistical period
- Geography and scope
- Geneva; global intergovernmental negotiations
- Source location
- Opening paragraphs and Notes to Editors
- Evidence type
- Institutional first-party press release
- Supports
- After ten days of negotiations, INC-5.2 adjourned on 2025-08-15 without consensus on treaty text; delegates agreed to resume later. The mandate covers the full plastics lifecycle.
- Limits
- Does not establish permanent failure, country motives or specific disputes. Plastic negotiations do not directly cover every solid-waste stream.
- Read
- 2026-10-10
- Original material
- Publisher link only; original material not redistributed. Public access is not treated as a redistribution licence.
[2]New Chair elected to lead negotiations on global plastic pollution treatyH02 · United Nations Environment Programme (UNEP) · 2026-02-07
- Publisher
- United Nations Environment Programme (UNEP)
- Published
- 2026-02-07
- Event
- Chair elected 2026-02-07
- Reporting period
- INC-5.3 organizational session; no industry statistical period
- Geography and scope
- Geneva; global intergovernmental negotiations
- Source location
- Main text and Notes to Editors
- Evidence type
- Institutional first-party press release
- Supports
- INC-5.3 elected Chilean Ambassador Julio Cordano as chair. The session addressed organizational matters and held no substantive negotiations.
- Limits
- Records the event on 2026-02-07; it cannot establish the complete negotiating status through the October cutoff.
- Read
- 2026-10-10
- Original material
- Publisher link only; original material not redistributed. Public access is not treated as a redistribution licence.
[3]The Sanitary Fill Method of Refuse DisposalH03 · Jean L. Vincenz; American Public Works Association; historical scan hosted by the City of Fresno · 1940 (Public Works Engineers' Yearbook); account includes proceedings from 1939
- Publisher
- Jean L. Vincenz; American Public Works Association; historical scan hosted by the City of Fresno
- Published
- 1940 (Public Works Engineers' Yearbook); account includes proceedings from 1939
- Event
- Service began 1934-10-15; paper appeared in the 1940 yearbook
- Reporting period
- Firsthand account of Fresno operations beginning 1934; operations discussed through 1939
- Geography and scope
- Fresno, California, United States
- Source location
- Original printed pp.187–193 (PDF pp.1–4); subsequent meeting discussion distinguished from the paper
- Evidence type
- Firsthand historical engineering paper in a professional yearbook
- Supports
- Describes trenching, compaction and earth cover, and the operational importance of land, haulage, running costs and public acceptance.
- Limits
- A contemporary practitioner account, not a modern safety standard or proof of present scientific claims. No claim that Fresno was the world's first sanitary landfill.
- Read
- 2026-10-10
- Original material
- Publisher link only; original material not redistributed. Public access is not treated as a redistribution licence.
[4]New Law to Control Hazardous Wastes, End Open Dumping, Promote Conservation of ResourcesH04 · United States Environmental Protection Agency (US EPA) · 1976-12-13
- Publisher
- United States Environmental Protection Agency (US EPA)
- Published
- 1976-12-13
- Event
- RCRA enacted 1976-10-21; historical release issued 1976-12-13
- Reporting period
- Historical account of RCRA enactment; no statistical period
- Geography and scope
- United States
- Source location
- Complete archived short release, especially paragraphs 1, 3 and 5
- Evidence type
- Original historical agency press release preserved in an official archive
- Supports
- RCRA introduced federal/state controls over hazardous-waste handling, transport and disposal, with groundwater protection and ending open dumping as stated concerns.
- Limits
- The stated 1983 deadline was a requirement, not proof of achieved elimination. The US milestone does not establish adoption dates elsewhere.
- Read
- 2026-10-10
- Original material
- Publisher link only; original material not redistributed. Public access is not treated as a redistribution licence.
[5]Basel Convention on the Control of Transboundary Movements of Hazardous Wastes and their Disposal: Text and AnnexesH05 · Secretariat of the Basel Convention; United Nations Environment Programme · May 2023 imprint; current downloadable copy includes 2024 notification footnotes; exact subsequent upload date not disclosed
- Publisher
- Secretariat of the Basel Convention; United Nations Environment Programme
- Published
- May 2023 imprint; current downloadable copy includes 2024 notification footnotes; exact subsequent upload date not disclosed
- Event
- Adopted 1989-03-22; entered into force 1992-05-05; plastic amendments adopted 2019 and effective 2021-01-01
- Reporting period
- Historical treaty milestones and rules; no statistical period
- Geography and scope
- Global treaty framework
- Source location
- Introduction printed p.4 (PDF p.5); Article 6 pp.15–17; Article 9 pp.18–19; B3011 pp.68–69
- Evidence type
- Official treaty text-and-annex compilation
- Supports
- Adopted in 1989 and effective in 1992; plastic amendments adopted in 2019 and effective in 2021. Controlled movements require prior notification and written consent. Specific clean, sorted plastic categories are treated differently.
- Limits
- Not a universal waste-trade ban. HS codes and destination alone do not determine legality. The compilation is informational; the authentic legal text is held by the UN depositary.
- Read
- 2026-10-10
- Original material
- Publisher link only; original material not redistributed. Public access is not treated as a redistribution licence.
[6]Directive 2008/98/EC of the European Parliament and of the Council of 19 November 2008 on waste and repealing certain DirectivesH06 · European Parliament and Council of the European Union · 2008-11-22 (Official Journal L 312)
- Publisher
- European Parliament and Council of the European Union
- Published
- 2008-11-22 (Official Journal L 312)
- Event
- Adopted 2008-11-19; published 2008-11-22
- Reporting period
- Original 2008 legal text; historical milestone, not the consolidated 2026 law
- Geography and scope
- European Union
- Source location
- Official Journal L 312 pp.3–30; Articles 3, 4, 6, 8, 13, 17 and 18
- Evidence type
- Original official legal text
- Supports
- Defines the waste hierarchy, separates energy recovery from recycling, permits extended producer responsibility, and establishes end-of-waste and hazardous-waste tracking/mixing principles.
- Limits
- Used for the 2008 historical framework; later amendments must be checked before stating current requirements. Does not show that EPR first appeared globally in 2008.
- Read
- 2026-10-10
- Original material
- Publisher link only; original material not redistributed. Public access is not treated as a redistribution licence.
[7]Announcement on Matters Concerning the Comprehensive Prohibition of Solid Waste Imports (Announcement No. 53 of 2020; translated title)H07 · Ministry of Ecology and Environment; Ministry of Commerce; National Development and Reform Commission; General Administration of Customs, China · 2020-11-25 (web publication); signed 2020-11-24
- Publisher
- Ministry of Ecology and Environment; Ministry of Commerce; National Development and Reform Commission; General Administration of Customs, China
- Published
- 2020-11-25 (web publication); signed 2020-11-24
- Event
- Signed 2020-11-24; published 2020-11-25; effective 2021-01-01
- Reporting period
- Prohibition applicable from 2021-01-01; no statistical period
- Geography and scope
- China
- Source location
- Complete four-article announcement; first two articles and effective-date clause
- Evidence type
- Original multi-agency official announcement
- Supports
- Prohibits solid-waste imports by any means from 2021-01-01 and ends acceptance/approval of restricted solid-waste import licences.
- Limits
- Not a ban on every secondary raw-material product classified as non-waste. The announcement does not quantify global price effects or trade rerouting.
- Read
- 2026-10-10
- Original material
- Publisher link only; original material not redistributed. Public access is not treated as a redistribution licence.
[8]Circular EconomyH08 · European Commission, Directorate-General for Environment · Not disclosed on the live policy overview; 2020 action-plan adoption date is specified
- Publisher
- European Commission, Directorate-General for Environment
- Published
- Not disclosed on the live policy overview; 2020 action-plan adoption date is specified
- Event
- Second Circular Economy Action Plan adopted 2020-03-11
- Reporting period
- Circular Economy Action Plan adopted in 2020; policy timeline, not a statistical series
- Geography and scope
- European Union
- Source location
- Circular Economy Action Plan (2020) section and policy timeline
- Evidence type
- Official policy overview
- Supports
- The 2020 action plan extends policy across product lifecycles, including design, waste prevention and retaining resources in the economy.
- Limits
- Action-plan objectives are not proof that every measure was then binding or achieved. Future legislative initiatives on the overview are not treated as enacted laws.
- Read
- 2026-10-10
- Original material
- Publisher link only; original material not redistributed. Public access is not treated as a redistribution licence.
[9]Global Plastics Outlook: Economic Drivers, Environmental Impacts and Policy OptionsH09 · Organisation for Economic Co-operation and Development (OECD) · 2022-02-22; PDF imprint notes revision in April 2022
- Publisher
- Organisation for Economic Co-operation and Development (OECD)
- Published
- 2022-02-22; PDF imprint notes revision in April 2022
- Event
- Report published 2022-02-22; core waste observations concern 2019
- Reporting period
- 2019 global plastics statistics; technical and policy analysis published in 2022
- Geography and scope
- Global plastics; not all solid waste
- Source location
- Executive Summary printed p.14; section 1.3.1 pp.19–20; Chapter 4 pp.83–100, especially sections 4.2–4.4; corresponding official full-report Chapter 4 also read
- Evidence type
- Institutional model and policy report; technical literature review
- Supports
- Only 9% of 2019 plastic waste was ultimately recycled after process losses. Mechanical recycling may reduce quality; secondary-plastic prices depend on virgin markets. Recycled-content demand and EPR/design policies address different sides of the market.
- Limits
- Plastic-only 2019 data cannot represent the whole industry or 2026 output. The 2022 chemical-recycling and food-contact discussions are not treated as current legal or commercial status.
- Read
- 2026-10-10
- Original material
- Publisher link only; original material not redistributed. Public access is not treated as a redistribution licence.
[10]Global Methane Assessment: Benefits and Costs of Mitigating Methane Emissions — Summary for Decision MakersH10 · United Nations Environment Programme; Climate and Clean Air Coalition · 2021-05-06
- Publisher
- United Nations Environment Programme; Climate and Clean Air Coalition
- Published
- 2021-05-06
- Event
- Assessment released 2021-05-06
- Reporting period
- Assessment-baseline synthesis; mitigation potential to 2030 is scenario analysis
- Geography and scope
- Global anthropogenic methane; landfill and wastewater combined
- Source location
- Summary printed/PDF pp.6–7, 10 and 13
- Evidence type
- Institutional scientific synthesis and mitigation assessment
- Supports
- Landfill and wastewater together account for about 20% of anthropogenic methane. Listed waste measures include source separation, organic diversion and landfill-gas recovery or flaring.
- Limits
- The 20% is not a solid-waste-only share or a share of all greenhouse gases. Mitigation potential is not achieved reduction or guaranteed project profitability.
- Read
- 2026-10-10
- Original material
- Publisher link only; original material not redistributed. Public access is not treated as a redistribution licence.
[11]Monitoring trade in plastic waste and scrap 2026H11 · Organisation for Economic Co-operation and Development (OECD); Environment Working Papers No. 279 · 2026-10-09
- Publisher
- Organisation for Economic Co-operation and Development (OECD); Environment Working Papers No. 279
- Published
- 2026-10-09
- Event
- Published 2026-10-09, one day before the report cutoff; data extracted 2025-09-17
- Reporting period
- 2014–2024; latest statistical year 2024; UN Comtrade extraction 2025-09-17
- Geography and scope
- Global reported plastic-waste/scrap exports under HS 3915, by mass
- Source location
- Executive Summary printed pp.8–9; section 3.1 p.19; Conclusion pp.32–33; Annex A pp.36–37
- Evidence type
- Institutional working paper using reported customs-trade statistics
- Supports
- In 2024, reported OECD-to-non-OECD plastic-waste exports rose by 0.21 million tonnes, or 15%, from 2023, showing continued changes in trade routes.
- Limits
- The latest data concern 2024, not 2026. Reported trade cannot reveal final treatment or fully distinguish transit. HS codes differ from Basel categories; missing/error-prone records limit conclusions on legality and outcomes.
- Read
- 2026-10-10
- Original material
- Publisher link only; original material not redistributed. Public access is not treated as a redistribution licence.
[12]Global Waste Management Outlook 2024: Beyond an Age of Waste — Turning Rubbish into a ResourceH12 · United Nations Environment Programme; International Solid Waste Association (ISWA) · 2024-02-28
- Publisher
- United Nations Environment Programme; International Solid Waste Association (ISWA)
- Published
- 2024-02-28
- Event
- Report launched 2024-02-28; costs modeled for 2020
- Reporting period
- 2020 MSW cost model; qualitative systems and treatment analysis
- Geography and scope
- Global municipal solid waste (MSW)
- Source location
- Sections 2.3.2, 2.3.4–2.3.5 and 2.4; cost model printed pp.30–31 and Annex 2; thermal treatment pp.25–26; section 4.3.2 p.52 and section 4.6.1 p.57
- Evidence type
- Institutional modeled-cost report and systems literature review
- Supports
- Models 2020 direct MSW costs at US$252.3bn and total costs, including external damage less recycling benefits, at US$361bn. Discusses ongoing operating funding, thermal-treatment conditions and informal workers.
- Limits
- Costs are not company revenue. Excluded inconsistent generation-year/growth statements: webpage 2023 versus PDF 2020, and stated 56% versus chart endpoints. Model values are estimates, not direct point measurements.
- Read
- 2026-10-10
- Original material
- Publisher link only; original material not redistributed. Public access is not treated as a redistribution licence.
[13]Packaging wasteH13 · European Commission, Directorate-General for Environment · Not disclosed on the live overview; cross-check implementation news published 2026-08-11
- Publisher
- European Commission, Directorate-General for Environment
- Published
- Not disclosed on the live overview; cross-check implementation news published 2026-08-11
- Event
- Entered into force 2025-02-11; application began 2026-08-12; later requirements phased to 2030
- Reporting period
- PPWR entry into force in 2025; application from 2026; phased requirements including 2030
- Geography and scope
- European Union packaging; not global solid waste
- Source location
- Background: Legislation, Status and Application date; Objectives; cross-checked against Commission implementation news https://environment.ec.europa.eu/news/new-eu-rules-packaging-enter-application-2026-08-11_en (main text and Next steps)
- Evidence type
- Official regulatory explanation and first-party implementation news
- Supports
- PPWR (EU) 2025/40 entered into force on 2025-02-11 and began applying on 2026-08-12, with phased implementation. Important recyclability and recycled-plastic-content requirements apply from 2030.
- Limits
- Official explanation, not the unread original legal text; EUR-Lex access was redirected or blocked by a JavaScript check. Does not establish precise thresholds, exemptions or measured policy outcomes.
- Read
- 2026-10-10
- Original material
- Publisher link only; original material not redistributed. Public access is not treated as a redistribution licence.
[14]What a Waste 3.0: Global Snapshot of Solid Waste Management toward CircularityG01 · World Bank · March 2026; publicly available by 2026-03-26 (launch page); PDF copyright 2026
- Publisher
- World Bank
- Published
- March 2026; publicly available by 2026-03-26 (launch page); PDF copyright 2026
- Event
- Report publicly available by 2026-03-26; the global baseline is modeled for 2022, with scenarios to 2050.
- Reporting period
- 2022 modeled baseline; BAU forecasts to 2050; underlying observations mainly 2020–2024
- Geography and scope
- Global, 217 countries/economies and 262 cities
- Source location
- Section 1.2 printed pp. 5–7 (PDF 41–43); Fig. S.1 p. xxiv (PDF 26); Fig.2.1 p. 14 (PDF 50); Summary pp. xxvii–xxx (PDF 29–32); special-waste limits pp. 43–44 (PDF 79–80)
- Evidence type
- Official research report; modeled/harmonized aggregate
- Supports
- Global MSW 2,562 Mt/year in 2022, BAU 3,855 Mt in 2050; regional volumes total 2,562 Mt. Global annual MSW management cost exceeds US$250 bn; BAU 2050 US$426 bn. Low/lower-middle-income investment 2022–2050 US$556 bn. Incineration explicitly means incineration with energy recovery throughout the report.
- Limits
- MSW excludes separately reported industrial, construction, agricultural, mining and other special waste. Country indicator years differ and adjustments can still miss flows. Costs/investment are not company revenue or a global all-waste TAM. Revision from 2018 includes methodological improvement. BAU is a scenario.
- Read
- 2026-10-10
- Original material
- Report copyright page PDF 6 explicitly CC BY 3.0 IGO with attribution/adaptation requirements; third-party material exceptions. Publisher links only in final package; original PDF not bundled.
[15]What a Waste 3.0, Figure 2.16: Global municipal solid waste treatment and disposalG02 · World Bank · March 2026; public by 2026-03-26
- Publisher
- World Bank
- Published
- March 2026; public by 2026-03-26
- Event
- Figure published in the March 2026 report; treatment and disposal shares use the modeled, mass-weighted 2022 baseline.
- Reporting period
- 2022 modeled/weighted baseline
- Geography and scope
- Global MSW only
- Source location
- Figure 2.16 printed p. 29 / PDF p. 65; methodology section 1.2 printed pp. 5–7 / PDF pp. 41–43; incineration definition printed p. 5 / PDF p. 41
- Evidence type
- Official published model chart; original integer percentages
- Supports
- Uncollected 17%, Recycling 15%, Composting & anaerobic digestion 6%, Incineration 20%, Sanitary landfill 17%, Controlled landfill 12%, Dumpsite 13%; sum 100%. Original Incineration label may be explained as energy-recovery incineration because section 1.2 defines it so.
- Limits
- A physical MSW composition, not all solid waste or company market share. Keep uncollected as its own slice; no extra self-burn/dump/recycling slices. No published unknown slice, but incomplete recording is possible. Underlying observations are not all 2022. No normalization or inferred route tonnage.
- Read
- 2026-10-10
- Original material
- CC BY 3.0 IGO report; new data chart may be adapted with attribution and adaptation disclaimer. No original PDF or image bundled in final deliverables.
[16]517 kg of municipal waste per capita generated in 2024; Municipal waste statisticsG03 · Eurostat · News 2026-03-30; methodology article data extracted January 2026
- Publisher
- Eurostat
- Published
- News 2026-03-30; methodology article data extracted January 2026
- Event
- News published 2026-03-30 for 2024 municipal statistics; separate MWRO compliance statistics concern 2023; methodology data extracted January 2026.
- Reporting period
- 2024 MWSJQ; separately 2023 MWRO compliance statistics
- Geography and scope
- European Union
- Source location
- News main text and methodology; Statistics Explained: definitions, data sources and municipal-waste legal reporting
- Evidence type
- Official statistical news and methodology article
- Supports
- EU 2024 municipal waste generated 517 kg/person, recycled 248 kg/person, recycling rate 48.1%; 2023 generated 511 kg/person and rate 48.0%. A separate legally reported 2023 preparation-for-reuse/recycling average 43.3% uses MWRO.
- Limits
- MSW only. Voluntary MWSJQ and legal MWRO have different calculation/measurement rules; do not use 48.1% to infer compliance with legal 2025 target. Article/news kg rounding differs, and a narrative landfill share is not used. These latest regional metrics cannot form a same-year comparison with US 2018 or China 2025.
- Read
- 2026-10-10
- Original material
- Eurostat's own EU content/data may be reused with attribution and changes identified (CC BY 4.0 editorial content), subject to individual/third-party exceptions; publisher links only in delivery, no original reproduced. Policy actually read: https://ec.europa.eu/eurostat/help/copyright-notice
- Related originals
- Related original 1
[17]Advancing Sustainable Materials Management: 2018 Tables and FiguresG04 · US Environmental Protection Agency · December 2020
- Publisher
- US Environmental Protection Agency
- Published
- December 2020
- Event
- 2018 national material-flow statistics published in December 2020; EPA identifies 2018 as the latest available national dataset.
- Reporting period
- 2018 (EPA landing explicitly identifies latest available national dataset)
- Geography and scope
- United States
- Source location
- Table 1 printed p. 1 / PDF p. 5; Table 2 printed pp. 2–3 / PDF pp. 6–7; national overview food-methodology notes
- Evidence type
- Official statistical report and official explanatory page
- Supports
- 2018 MSW 292,360 thousand US short tons generated; 69,090 recycled; 24,890 composted; 93,980 combined; 32.1% recycling + composting. Other food management 17,710 thousand short tons is separate. 1 short ton = 0.90718474 metric tonne; 292.36 million converts to 265.224531 million metric tonnes.
- Limits
- US short tons differ from metric tonnes. Excludes C&D and industrial process wastes/sludges. 2018 food method expanded; no unqualified 2017–2018 growth inference. Regional reference is 2018, not current global 2022 or 2025 estimate.
- Read
- 2026-10-10
- Original material
- Publisher link only; no original redistributed. EPA disclaimer permits scientific/educational non-commercial distribution but notes individual-document conditions and potentially protected commercial uses; blanket public-domain claim avoided. Policy: https://www.epa.gov/web-policies-and-procedures/epa-disclaimers
- Related originals
- Related original 1
[18]2025 Report on the State of the Ecology and Environment in ChinaG05 · Ministry of Ecology and Environment, China · Catalogue 2026-06-04; official formal release 2026-06-05
- Publisher
- Ministry of Ecology and Environment, China
- Published
- Catalogue 2026-06-04; official formal release 2026-06-05
- Event
- Preliminary statistics concern 2025; the catalogue is dated 2026-06-04 and the official formal release is dated 2026-06-05.
- Reporting period
- 2025 preliminary statistics
- Geography and scope
- China; city MSW series separately restricted to cities
- Source location
- Printed pp. 128–130 / PDF pp. 132–134; solid waste sections 1–5
- Evidence type
- Official annual environment report; scanned/vector pages visually read
- Supports
- General industrial solid waste 4.41 billion tonnes generated, 2.65 billion utilized, 0.82 billion disposed. City MSW 26482.13 ten-thousand tonnes collected = 264.8213 Mt; 26481.96 ten-thousand tonnes treated = 264.8196 Mt; capacity 120.17 ten-thousand tonnes/day = 1,201,700 t/day. Five regulated WEEE categories over 100 million units treated and about 3 Mt recovered materials.
- Limits
- Preliminary. City collected/treated waste is not all-China urban/rural MSW generated. Utilization/disposal may include prior stock, so do not infer an untreated residual. Hazardous 130 Mt concerns generators above 10 t/year and rounded amounts; no overall safe-management rate inferred. Five-category WEEE units cannot represent all e-waste.
- Read
- 2026-10-10
- Original material
- Publisher link only; original material not redistributed. Public access is not treated as a redistribution licence. No explicit open redistribution licence located in the report; research PDF/images stay out of final delivery archive.
- Related originals
- Related original 1
[19]Waste statisticsG06 · Eurostat · Data extracted September 2024; next scheduled update 2026-10-29
- Publisher
- Eurostat
- Published
- Data extracted September 2024; next scheduled update 2026-10-29
- Event
- Statistical year 2022; article data extracted September 2024; the next scheduled update is 2026-10-29, after the report cutoff.
- Reporting period
- 2022
- Geography and scope
- European Union
- Source location
- Waste generation totals, main sectors, hazardous/non-mineral waste, waste treatment and data-source sections
- Evidence type
- Official statistical article
- Supports
- Generated 2,233 Mt; construction 38.4%, mining 22.7%, waste/water services 10.5%, manufacturing 10.4%, households 8.9%, other 9.2%. Treated 1,992 Mt; recycling 40.8%, backfilling 14.2%, energy recovery 6.4%, landfill 30.2%, incineration without energy recovery 0.4%, other disposal 8.0%. Hazardous 119 Mt.
- Limits
- Regulatory all-waste includes sludge and is not only dry solids. Generation sector shares sum 100.1% due rounding. Treatment includes imports and excludes exports, so not directly generated-volume denominator. Latest year in this consulted article 2022; not a claim that no separate 2024 dataset exists.
- Read
- 2026-10-10
- Original material
- Eurostat's own EU content/data may be reused with attribution and changes identified (CC BY 4.0 editorial content), subject to individual/third-party exceptions; publisher links only in delivery, no original reproduced. Policy actually read: https://ec.europa.eu/eurostat/help/copyright-notice
[20]Construction and Demolition Debris: Material-Specific DataG07 · US Environmental Protection Agency · Page updated 2025-10-23; underlying 2018 facts published December 2020
- Publisher
- US Environmental Protection Agency
- Published
- Page updated 2025-10-23; underlying 2018 facts published December 2020
- Event
- Underlying 2018 statistics published in December 2020; the material-specific page was updated 2025-10-23.
- Reporting period
- 2018
- Geography and scope
- United States
- Source location
- 2018 generation and destination tables
- Evidence type
- Official material-specific statistical page
- Supports
- C&D debris 600,330 thousand US short tons generated; manufactured products 131,590; aggregate 313,070; soil 1,890; compost/mulch 2,460; fuel 7,540; landfill 143,780 thousand short tons, total 600,330.
- Limits
- Separate from MSW and includes buildings, roads, bridges. Next use includes fuel and is not solely closed-loop material recycling. 2018 cannot be added to 2022 global MSW to fabricate all-waste total.
- Read
- 2026-10-10
- Original material
- Publisher link only; original not reproduced; EPA policy consulted, individual and third-party conditions remain.
[21]Global Waste Management Outlook 2024: Beyond an age of waste—Turning rubbish into a resourceG08 · UNEP and ISWA · 2024-02-28
- Publisher
- UNEP and ISWA
- Published
- 2024-02-28
- Event
- Report launched 2024-02-28; the full report uses a 2020 MSW model baseline and scenarios to 2050.
- Reporting period
- 2020 model baseline; 2050 scenarios
- Geography and scope
- Global MSW
- Source location
- Scope p. 10; Box 1 p. 17; Fig. 3 p. 18; Fig. 7 p. 21; copyright p. 2
- Evidence type
- Official report; older MSW model, cross-check only
- Supports
- Full report 2020 baseline 2.126 billion tonnes; 2050 BAU 3.782 billion. Detailed 2020 routes 2,125,971 thousand tonnes total: 404,271 recycling, 274,800 WtE, 641,256 landfilling, 805,644 uncontrolled. Demonstrates varying model/data vintages.
- Limits
- Landing summary calls 2.1 billion 2023 but full report calls baseline 2020. A 56% growth sentence conflicts with exact displayed numbers. Do not splice with WB 3.0 for precise historical growth or current chart. Costs include societal externalities and are not company revenues.
- Read
- 2026-10-10
- Original material
- PDFp.2 permits acknowledged educational/non-profit reproduction; commercial/resale reproduction requires prior written UNEP permission; maps/photos/illustrations separately credited. Publisher link only, no original packaged.
[22]Guide for Industrial Waste Management (draft), EPA 530-R-99-001G09 · US Environmental Protection Agency · May 1999 draft
- Publisher
- US Environmental Protection Agency
- Published
- May 1999 draft
- Event
- May 1999 draft guide presents a historical 1990s industrial-waste estimate; it is not a current solid-waste-volume observation.
- Reporting period
- Historic 1990s estimate
- Geography and scope
- United States
- Source location
- Introduction p. VIII
- Evidence type
- Official historic report; rejected for current solid-waste volume
- Supports
- The frequently quoted 7.6 billion tons industrial waste estimate is 97% wastewater in surface impoundments; it does not substantiate current dry industrial solid-waste generation.
- Limits
- Historic draft and liquid-dominated boundary; not current market-size evidence.
- Read
- 2026-10-10
- Original material
- Publisher link only; original material not redistributed. Public access is not treated as a redistribution licence.
[23]2024 Annual Report of Ecological and Environmental StatisticsG10 · Ministry of Ecology and Environment, China · 2025-11-28
- Publisher
- Ministry of Ecology and Environment, China
- Published
- 2025-11-28
- Event
- Statistics concern 2024; the annual report was published 2025-11-28.
- Reporting period
- 2024
- Geography and scope
- China; key-survey industrial enterprises
- Source location
- Section 4.1 printed p. 28 / PDF p. 28
- Evidence type
- Official annual statistics report
- Supports
- 2024 general industrial solid waste 4.40 billion tonnes generated, 2.65 billion utilized, 0.80 billion disposed; key-survey scope includes mining, manufacturing, electricity/heat/gas/water. Industrial hazardous 120 Mt generated 118 Mt utilized/disposed.
- Limits
- Older than 2025 preliminary report. Do not assert identical 2025 coverage based only on 2024 method. Do not infer all current generated waste processed from utilization/disposal ratios.
- Read
- 2026-10-10
- Original material
- Publisher link only; original material not redistributed. Public access is not treated as a redistribution licence.
[24]Public global company-share data feasibility auditG11 · Research audit of MarketsandMarkets mirror, DataIntelo and selected-listed-competitor tables · 2021 report/2020 share intervals; 2025 commercial estimates with 2026 page updates
- Publisher
- Research audit of MarketsandMarkets mirror, DataIntelo and selected-listed-competitor tables
- Published
- 2021 report/2020 share intervals; 2025 commercial estimates with 2026 page updates
- Event
- The 2021 report gives 2020 company-share intervals; other commercial estimates concern 2025 and appear on pages updated in 2026. Periods and scopes are incompatible.
- Reporting period
- Incompatible periods/scopes; no usable point-share dataset
- Geography and scope
- Claimed global but nonuniform enterprise universe
- Source location
- MarketsandMarkets Table 102 p. 138; DataIntelo scope/competitive sections
- Evidence type
- Audit/rejection evidence, not accepted market-share data
- Supports
- No publicly verified same-year same-scope nonoverlapping complete company point shares located; 2020 report has intervals and internal CR5/other inconsistencies; 2025 pages omit precise public shares or mix business boundaries. Shares rejected; alternative chart definition is documented in Figure methods.
- Limits
- Not proof that commercial data do not exist. No midpoints invented, no company total revenue divided by incompatible market estimates. Not primary industry facts used for ranking.
- Read
- 2026-10-10
- Original material
- Link only; confidential/commercial originals not downloaded or redistributed.
- Related originals
- Related original 1 · Related original 2
[25]WM Announces Fourth Quarter and Full-Year 2025 EarningsC01 · Waste Management Inc · 2026-01-28
- Publisher
- Waste Management Inc
- Published
- 2026-01-28
- Event
- Financial period 2025; recycling and RNG projects completed during 2025.
- Reporting period
- Year ended 2025-12-31
- Geography and scope
- Primarily US and Canada; healthcare also Western Europe
- Source location
- Full-year highlights; Revenue; Healthcare Solutions; footnotes (a), (e), (g)
- Evidence type
- Company primary disclosure
- Supports
- Revenue US$25.204 bn; legacy business US$22.696 bn; healthcare US$2.508 bn; adjusted operating EBITDA margin 30.1%; collection/disposal core price 6.3%, volume 0.1%; recycled commodity average US$75/ton versus US$92/ton in 2024; recycling and RNG projects completed.
- Limits
- Company-wide revenue includes healthcare and secure destruction. EBITDA is non-GAAP; core price and volume are company-defined. Its commodity basket is not comparable to another company's basket. Not global share.
- Read
- 2026-10-10
- Original material
- Publisher link only; original material not redistributed
[26]Republic Services Reports Fourth Quarter and Full-Year 2025 ResultsC02 · Republic Services Inc · 2026-02-17
- Publisher
- Republic Services Inc
- Published
- 2026-02-17
- Event
- Projects became operational during 2025; results published 2026-02-17.
- Reporting period
- Year ended 2025-12-31
- Geography and scope
- US and Canada operations as company disclosed
- Source location
- 2025 highlights; consolidated income; adjusted EBITDA by business
- Evidence type
- Company primary disclosure
- Supports
- Revenue US$16.591 bn; adjusted EBITDA US$5.307 bn and margin 32.0%; Indianapolis Polymer Center began operations; nine RNG projects commenced operation; average recycled commodity price US$135/ton, down US$29/ton.
- Limits
- Includes environmental solutions and acquisitions. Adjusted EBITDA non-GAAP. Recycled commodity mix not directly comparable to WM; no global share.
- Read
- 2026-10-10
- Original material
- Publisher link only; original material not redistributed
[27]Waste Connections Reports Fourth Quarter 2025 Results and Provides 2026 OutlookC03 · Waste Connections Inc · 2026-02-11
- Publisher
- Waste Connections Inc
- Published
- 2026-02-11
- Event
- Acquisitions closed during 2025; full-year results published 2026-02-11.
- Reporting period
- Year ended 2025-12-31
- Geography and scope
- US and Canada
- Source location
- Full Year 2025 Highlights and Results; About Waste Connections
- Evidence type
- Company primary disclosure
- Supports
- Revenue US$9.467 bn, versus US$8.920 bn in 2024; adjusted EBITDA US$3.125 bn and 33.0% margin; completed acquisitions representing about US$330 m annualized revenue; integrated collection transfer disposal and resource recovery.
- Limits
- Adjusted EBITDA non-GAAP. Annualized acquisition revenue not revenue recognized during 2025 and not backlog. Primarily regional footprint not global share.
- Read
- 2026-10-10
- Original material
- Publisher link only; original material not redistributed
[28]Veolia Annual Results 2025C04 · Veolia Environnement · 2026-02-26
- Publisher
- Veolia Environnement
- Published
- 2026-02-26
- Event
- Contract wins and extensions reported for 2025; the Clean Earth deal was described prospectively in the annual-results disclosure, not as a completed transaction.
- Reporting period
- Year ended 2025-12-31
- Geography and scope
- Group international waste business
- Source location
- Printed pp 10-12; PDF pages 10-12; revenue and EBITDA by business; business developments p 7
- Evidence type
- Company primary disclosure
- Supports
- Waste revenue EUR 15.443 bn; Solid Waste EUR 11.226 bn; Hazardous Waste EUR 4.217 bn; waste EBITDA EUR 2.252 bn and 14.6% margin; hazardous waste EBITDA margin 16.3%; waste like-for-like revenue growth 1.4%; UK waste contracts won/extended with cumulated backlog above GBP 1 bn.
- Limits
- Do not use total group EUR 44.396 bn as waste revenue. Constant-scope growth differs from reported change. Company EBITDA definitions differ from peers. GBP 1 bn cumulative backlog not annual realized revenue; no global share.
- Read
- 2026-10-10
- Original material
- Publisher link only; original material not redistributed
[29]TOMRA publishes Annual Report 2025 Circular FoundationsC05 · TOMRA Systems ASA · 2026-03-20
- Publisher
- TOMRA Systems ASA
- Published
- 2026-03-20
- Event
- Operating developments concern 2025; annual-report announcement published 2026-03-20.
- Reporting period
- Year 2025
- Geography and scope
- International equipment and service business
- Source location
- Solid financial foundation; divisional updates
- Evidence type
- Company primary disclosure
- Supports
- Group revenue EUR 1.32 bn; revenue declined 2%; EBITA margin 13%; collection installed base above 91,900 reverse vending machines; Recycling faced challenging markets.
- Limits
- Group includes Food sorting and other ventures; group revenue not solely waste recycling. EBITA not EBITDA; machines installed base not annual shipment or share. Do not assume every listed technology commercially economic.
- Read
- 2026-10-10
- Original material
- Publisher link only; original material not redistributed
[30]Sims Limited Annual Report 2025C06 · Sims Limited · 2025; exact publication day not verified; linked copy under 2025/12
- Publisher
- Sims Limited
- Published
- 2025; exact publication day not verified; linked copy under 2025/12
- Event
- Financial year ended 2025-06-30; the report is dated 2025, with no verified exact original publication day.
- Reporting period
- Financial year ended 2025-06-30
- Geography and scope
- Metal recycling and lifecycle services across multiple countries
- Source location
- Printed p 84 consolidated income; p 95 note 3; p 92 note 2; p 8 business overview
- Evidence type
- Company audited annual report
- Supports
- Sales revenue continuing operations A$7.4940 bn; total revenue incl other revenue A$7.5245 bn; net loss continuing + discontinued A$19.0 m; raw material expense A$5.3453 bn; ferrous/non-ferrous collection processing trading; IT reuse and recycling; 50% equity interest SA Recycling.
- Limits
- Use sales revenue not total revenue when table label says sales. FY ends June 30 not December 31. SA Recycling equity-accounted; do not add its gross sales. Scrap sales include purchased material value; unlike waste treatment service fees.
- Read
- 2026-10-10
- Original material
- Publisher link only; original material not redistributed
[31]SUEZ 2025 results investor presentationC07 · SUEZ · 2026-04-09
- Publisher
- SUEZ
- Published
- 2026-04-09
- Event
- 2025 financial results presented 2026-04-09.
- Reporting period
- Year ended 2025-12-31
- Geography and scope
- France UK and international
- Source location
- Slides 14, 16, 17, 21 (PDF pp 14, 16, 17, 21)
- Evidence type
- Company primary investor presentation
- Supports
- Group revenue EUR 9.520 bn; EBITDA EUR 1.539 bn; net loss EUR 657 m including PPA and exceptional items; Waste France 41%, Water France 23%, UK 15%, International 16%, Hazardous Waste 5% of group revenue; waste earnings exposure to electricity and recycling prices.
- Limits
- Not a clean consolidated waste-only revenue denominator. Business percentages rounded and geography names not pure geographic segments. Do not infer waste sales by multiplying rounded 41% plus other business percentages. Group includes water. No industry share.
- Read
- 2026-10-10
- Original material
- Publisher link only; original material not redistributed
[32]AUTOSORT automated sorting systems for recyclingC08 · TOMRA · Not disclosed on current product page
- Publisher
- TOMRA
- Published
- Not disclosed on current product page
- Event
- Product description available on 2026-10-10; a product-launch or other event date is not disclosed.
- Reporting period
- Product description accessible 2026-10-10
- Geography and scope
- International equipment
- Source location
- Product overview and technologies
- Evidence type
- Manufacturer primary product description
- Supports
- Sensor-based sorting equipment for waste and recycling, with machine intelligence and sorting capabilities.
- Limits
- Manufacturer description supports product role; not independent proof of plant-wide recovery yields, ROI, cost, installations or customer contracts.
- Read
- 2026-10-10
- Original material
- Publisher link only; original material not redistributed
[33]Kanadevia Inova wins contract to supply two new lines at Schwandorf waste-to-energy plantC09 · Kanadevia Inova · 2024-07-26
- Publisher
- Kanadevia Inova
- Published
- 2024-07-26
- Event
- Contract signed or announced 2024-07-26.
- Reporting period
- Contract announcement 2024
- Geography and scope
- Schwandorf Germany
- Source location
- Main announcement; EPC scope and capacity
- Evidence type
- Supplier primary contract announcement
- Supports
- EPC contract with Zweckverband Müllverwertung Schwandorf replaces three old lines with two new lines; scope combustion, boiler, flue-gas treatment and associated engineering; design 22 t/h per line, about 350,000 tonnes/year combined.
- Limits
- Design capacity is not actual throughput or 2026 commissioning proof. No contract value disclosed. Current page retitles historical HZI brand to Kanadevia Inova; do not imply the 2024 name was already current.
- Read
- 2026-10-10
- Original material
- Publisher link only; original material not redistributed
[34]The Global E-waste Monitor 2024C10 · ITU and UNITAR · 2024-03-20
- Publisher
- ITU and UNITAR
- Published
- 2024-03-20
- Event
- Report launched 2024-03-20; waste statistics concern 2022 and the legislation snapshot concerns 2023.
- Reporting period
- 2022 global e-waste; 2023 legislation snapshot
- Geography and scope
- Global
- Source location
- Background and Key Findings and Statistics
- Evidence type
- Joint institutional modeled statistics
- Supports
- Global e-waste 62 bn kg = 62 Mt in 2022; documented formal collection/recycling 22.3%; Europe 42.8%; Africa less than 1%.
- Limits
- Documented formal collection/recycling is not final recovered metal yield. E-waste is a distinct waste stream and may overlap with MSW; no summation. Not 2026 current output.
- Read
- 2026-10-10
- Original material
- Publisher link only; original material not redistributed
[35]Growth in waste recovery in 2022C11 · Eurostat · 2024-10-17
- Publisher
- Eurostat
- Published
- 2024-10-17
- Event
- Statistical year 2022; release published 2024-10-17.
- Reporting period
- 2022 waste treated
- Geography and scope
- EU
- Source location
- Article main text and methodology
- Evidence type
- Official statistical release
- Supports
- EU treated 1,992 Mt of waste in 2022; 61.4% recovered and 38.6% disposed; recovery includes recycling/backfilling/energy recovery.
- Limits
- All-waste treatment broad scope, not MSW; recovery not recycling. Treatment not generation; can include imports and exclude exported treatment. Historical 2022 observation not claimed latest full-sector statistic.
- Read
- 2026-10-10
- Original material
- Publisher link only; original material not redistributed
Figure methods and boundaries
Shares of global municipal solid waste generated by mass; World Bank's modeled 2022 baseline. National observations are harmonized and weighted by 2022 waste generation. Published integer percentages sum to 100%. This chart is not company market share or a breakdown of all solid-waste streams.
Use the seven original published percentages directly. 17+15+6+20+17+12+13=100. No normalization, midpoint substitution, or reverse calculation of absolute tonnes.
The 2050 scenario is approximately 50.5% above the 2022 baseline: (3,855/2,562 − 1) × 100 = 50.468%. Published endpoints in million tonnes are used; this is not revenue growth. [14][15]
Role classification as of 10 October 2026. Company names are examples; lines do not establish supply contracts. Companies may appear in more than one role. Sources[25][26][27][28][29][30][31][32][33][6][8][9][12].
The processing chart is adapted from World Bank data under CC BY 3.0 IGO. The adaptation’s views and interpretations belong to the report authors and are not endorsed by the World Bank.
I01 · Cover photograph and image evidence
Photo: STEINERT, ‘STEINERT UniSort PR’ (29 January 2019), via Wikimedia Commons, CC BY 4.0. Original photograph unchanged; web display resized and may be cropped to fit. No endorsement implied.
- Photographer / rights holder
- STEINERT
- Photographed
- 2019-01-29
- Uploaded
- 2019-11-15
- Read
- 2026-10-10
- License
- Creative Commons Attribution 4.0 International (CC BY 4.0)
- Changes
- None. Downloaded Wikimedia Commons original file without enlargement, retouching, generative processing, or cropping. Responsive layout may crop the displayed viewport using CSS object-fit: cover; the downloadable original is unchanged.
- Original width (pixels)
- 3008
- Original height (pixels)
- 2008
- Source description
- Wikimedia Commons file page
- License deed
- Creative Commons Attribution 4.0 International
- Original file
- View unchanged 3008 × 2008 photograph · Publisher’s original image
- Caption and limits
- STEINERT UniSort PR equipment in a post-consumer packaging recycling plant. Photograph dated 29 January 2019; location not identified in the source description. The image documents this equipment configuration; it does not establish plant capacity, recovery yield, financial performance, or a global market ranking.