Read the article & original appendix Link to this collection
-
STEINERT, “STEINERT UniSort PR”
Cited in: Article
Citation context · 2 locations
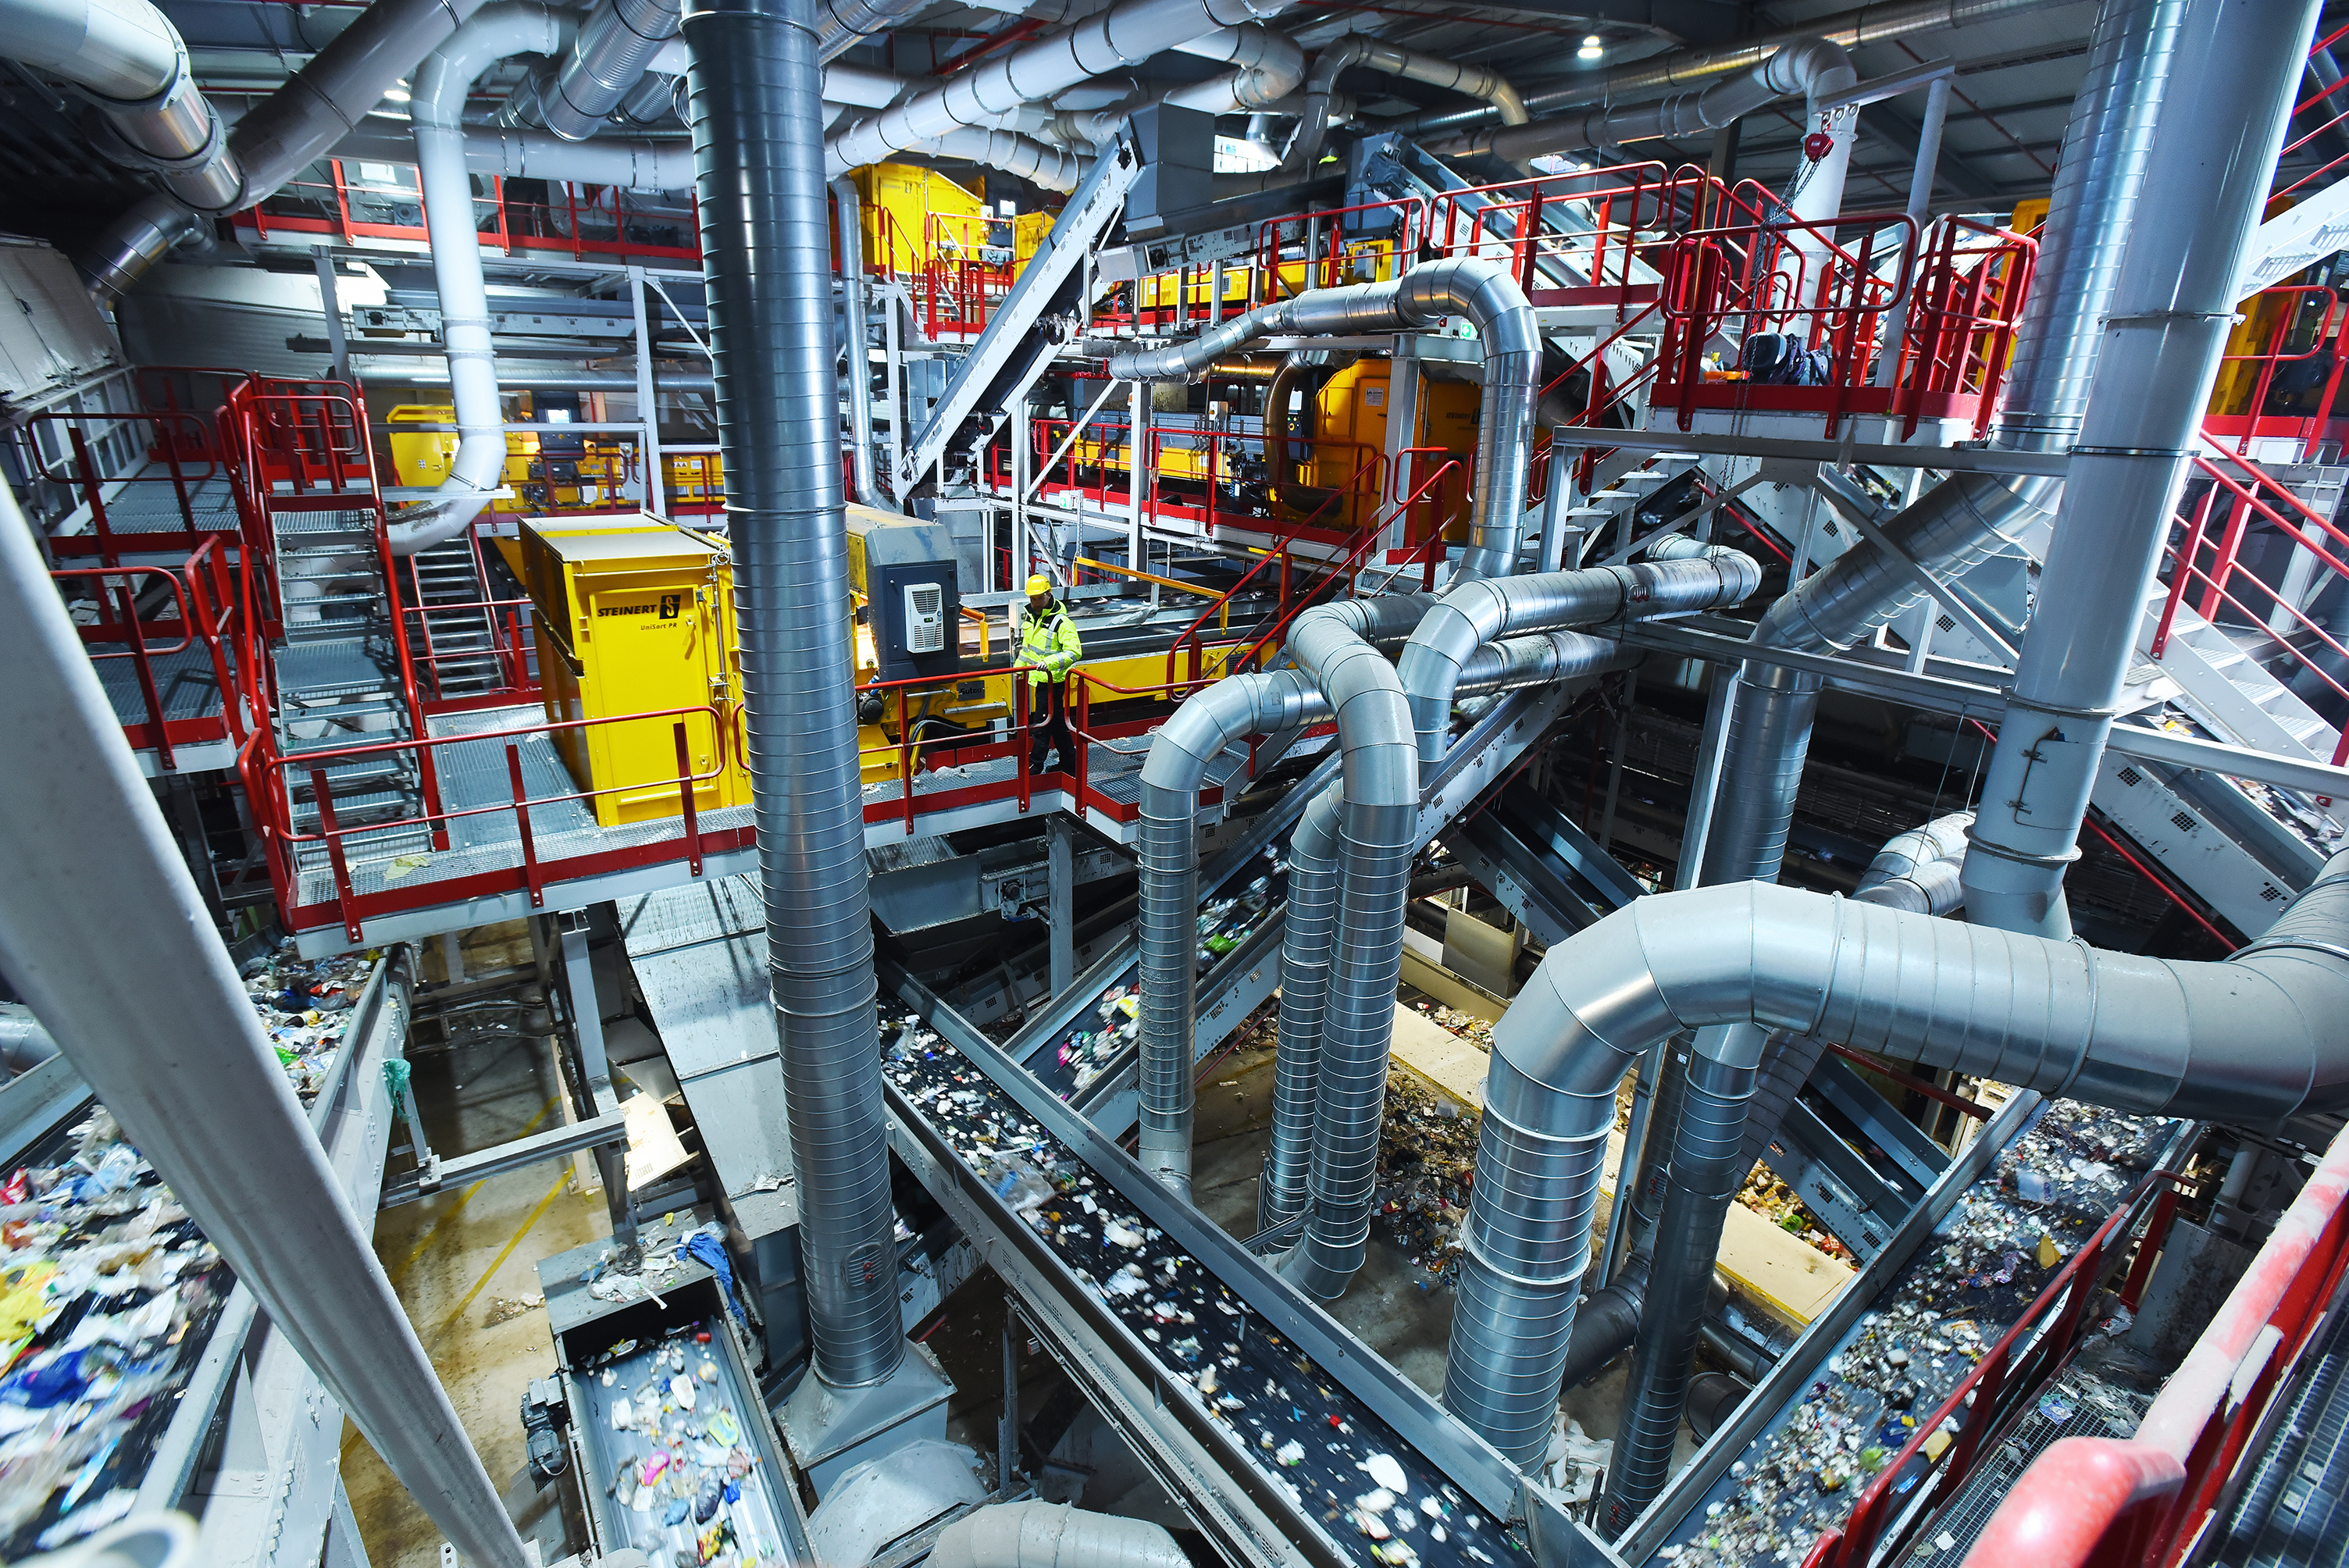
ArticlePhoto: STEINERT, “STEINERT UniSort PR” · CC BY 4.0 · 29 January 2019. Original photograph unchanged; responsive web versions resized and the display may be cropped to fit. Image evidence I01 .
Industry report · Version 1.1 · Global market · Public information cutoff 10 October 2026.
This report examines municipal solid waste, commercial and industrial residues, construction and demolition materials, hazardous waste, and electronic waste through the businesses that collect, treat and recover them. Agricultural residues and mining wastes are discussed where relevant to material recovery; wastewater services and primary mining are outside the core scope. Statistical boundaries vary, so the report does not present an invented aggregate for every solid-waste stream.
The central finding is that reliable collection, permitted treatment and saleable recovered outputs determine commercial value together. Service revenue can remain resilient while recycled commodity prices weaken. A large physical waste burden does not automatically become a profitable addressable market: someone must fund collection, pay for safe disposal, and purchase recovered materials.
All monetary figures retain their original currencies and accounting definitions. The company comparison uses 2025 full-year disclosures; Sims has a June financial year-end. Later public policy and statistical publications are included through the cutoff. Forecasts are identified as forecasts. The treatment-pathway chart covers municipal solid waste only; the company comparison retains each business's distinct reporting scope.
I01 · Cover photograph and image evidenceWikimedia Commons file page
Photo: STEINERT, ‘STEINERT UniSort PR’ (29 January 2019), via Wikimedia Commons, CC BY 4.0. Original photograph unchanged; web display resized and may be cropped to fit. No endorsement implied.
-
Creative Commons Attribution 4.0 International
Cited in: Article
Citation context · 2 locations
ArticlePhoto: STEINERT, “STEINERT UniSort PR” · CC BY 4.0 · 29 January 2019. Original photograph unchanged; responsive web versions resized and the display may be cropped to fit. Image evidence I01 .
Industry report · Version 1.1 · Global market · Public information cutoff 10 October 2026.
This report examines municipal solid waste, commercial and industrial residues, construction and demolition materials, hazardous waste, and electronic waste through the businesses that collect, treat and recover them. Agricultural residues and mining wastes are discussed where relevant to material recovery; wastewater services and primary mining are outside the core scope. Statistical boundaries vary, so the report does not present an invented aggregate for every solid-waste stream.
The central finding is that reliable collection, permitted treatment and saleable recovered outputs determine commercial value together. Service revenue can remain resilient while recycled commodity prices weaken. A large physical waste burden does not automatically become a profitable addressable market: someone must fund collection, pay for safe disposal, and purchase recovered materials.
All monetary figures retain their original currencies and accounting definitions. The company comparison uses 2025 full-year disclosures; Sims has a June financial year-end. Later public policy and statistical publications are included through the cutoff. Forecasts are identified as forecasts. The treatment-pathway chart covers municipal solid waste only; the company comparison retains each business's distinct reporting scope.
I01 · Cover photograph and image evidenceCreative Commons Attribution 4.0 International
Photo: STEINERT, ‘STEINERT UniSort PR’ (29 January 2019), via Wikimedia Commons, CC BY 4.0. Original photograph unchanged; web display resized and may be cropped to fit. No endorsement implied.
-
Article text without Supporting Evidence
Cited in: Article
Citation context
ArticleArticle text without Supporting Evidence · Complete English report with Supporting Evidence · Supporting Evidence
Industry report · Version 1.1 · Global market · Public information cutoff 10 October 2026.
This report examines municipal solid waste, commercial and industrial residues, construction and demolition materials, hazardous waste, and electronic waste through the businesses that collect, treat and recover them. Agricultural residues and mining wastes are discussed where relevant to material recovery; wastewater services and primary mining are outside the core scope. Statistical boundaries vary, so the report does not present an invented aggregate for every solid-waste stream.
The central finding is that reliable collection, permitted treatment and saleable recovered outputs determine commercial value together. Service revenue can remain resilient while recycled commodity prices weaken. A large physical waste burden does not automatically become a profitable addressable market: someone must fund collection, pay for safe disposal, and purchase recovered materials.
All monetary figures retain their original currencies and accounting definitions. The company comparison uses 2025 full-year disclosures; Sims has a June financial year-end. Later public policy and statistical publications are included through the cutoff. Forecasts are identified as forecasts. The treatment-pathway chart covers municipal solid waste only; the company comparison retains each business's distinct reporting scope.
-
Complete English report with Supporting Evidence
Cited in: Article
Citation context
ArticleArticle text without Supporting Evidence · Complete English report with Supporting Evidence · Supporting Evidence
Industry report · Version 1.1 · Global market · Public information cutoff 10 October 2026.
This report examines municipal solid waste, commercial and industrial residues, construction and demolition materials, hazardous waste, and electronic waste through the businesses that collect, treat and recover them. Agricultural residues and mining wastes are discussed where relevant to material recovery; wastewater services and primary mining are outside the core scope. Statistical boundaries vary, so the report does not present an invented aggregate for every solid-waste stream.
The central finding is that reliable collection, permitted treatment and saleable recovered outputs determine commercial value together. Service revenue can remain resilient while recycled commodity prices weaken. A large physical waste burden does not automatically become a profitable addressable market: someone must fund collection, pay for safe disposal, and purchase recovered materials.
All monetary figures retain their original currencies and accounting definitions. The company comparison uses 2025 full-year disclosures; Sims has a June financial year-end. Later public policy and statistical publications are included through the cutoff. Forecasts are identified as forecasts. The treatment-pathway chart covers municipal solid waste only; the company comparison retains each business's distinct reporting scope.
-
Global municipal solid waste pathways, 2022 — data (CSV)
Cited in: Global municipal solid waste pathways, 2022
Citation context
Global municipal solid waste pathways, 2022Download data (CSV)
Municipal solid waste only; a physical mass composition, not company revenue shares or the whole solid-waste industry's market share.
Worldwide · Percent of municipal solid waste generated by mass
Shares of global municipal solid waste generated by mass; World Bank's modeled 2022 baseline. National observations are harmonized and weighted by 2022 waste generation. Published integer percentages sum to 100%. This chart is not company market share or a breakdown of all solid-waste streams. Use the seven original published percentages directly. 17+15+6+20+17+12+13=100. No normalization, midpoint substitution, or reverse calculation of absolute tonnes. Adapted from World Bank data under CC BY 3.0 IGO. The views and interpretations in the adaptation are the report authors’ and are not endorsed by the World Bank.
-
World Bank — Cook, Ionkova, Bhada-Tata, Yadav and van Woerden (2026), What a Waste 3.0, World Bank, Figure 2.16, printed page 29, PDF page 65
Cited in: Global municipal solid waste pathways, 2022
Citation context · 3 locations
Global municipal solid waste pathways, 2022Source: World Bank — Cook, Ionkova, Bhada-Tata, Yadav and van Woerden (2026), What a Waste 3.0, World Bank, Figure 2.16, printed page 29, PDF page 65 (March 2026; public by 2026-03-26). Reviewed 2026-10-10.
Municipal solid waste only; a physical mass composition, not company revenue shares or the whole solid-waste industry's market share.
Worldwide · Percent of municipal solid waste generated by mass
Shares of global municipal solid waste generated by mass; World Bank's modeled 2022 baseline. National observations are harmonized and weighted by 2022 waste generation. Published integer percentages sum to 100%. This chart is not company market share or a breakdown of all solid-waste streams. Use the seven original published percentages directly. 17+15+6+20+17+12+13=100. No normalization, midpoint substitution, or reverse calculation of absolute tonnes. Adapted from World Bank data under CC BY 3.0 IGO. The views and interpretations in the adaptation are the report authors’ and are not endorsed by the World Bank.
The global municipal waste processing mixSource: Cook, Ionkova, Bhada-Tata, Yadav and van Woerden (2026), What a Waste 3.0, World Bank, Figure 2.16, printed page 29, PDF page 65 [15]
Shares of global municipal solid waste generated by mass; World Bank's modeled 2022 baseline. National observations are harmonized and weighted by 2022 waste generation. Published integer percentages sum to 100%. This chart is not company market share or a breakdown of all solid-waste streams.
Use the seven original published percentages directly. 17+15+6+20+17+12+13=100. No normalization, midpoint substitution, or reverse calculation of absolute tonnes.
2022 baseline modeled/weighted aggregate. National treatment observations can come from differing years, predominantly 2020-24. Shares are weighted by 2022 waste generation. Original country and city data are adjusted for missing flows including uncollected waste, informal-sector collection and nonhousehold MSW. See section 1.2, printed pages 5-7, and Appendix C.
Use the report's seven categories as published. Uncollected waste remains a distinct category; do not add self-managed uncollected burning, dumping, recycling or composting as additional slices.
No separate unknown slice is published in Figure 2.16. This does not imply every physical flow was measured: World Bank notes conservative model adjustments may still leave unrecorded flows.
Original Figure 2.16 says Incineration. Section 1.2 printed p. 5 / PDF p. 41 expressly defines all incineration references in the report as incineration with energy recovery. Recycling is separately classified from composting and anaerobic digestion; no unsupported reuse expansion.
The seven published shares are uncollected 17%, recycling 15%, composting and anaerobic digestion 6%, incineration with energy recovery 20%, sanitary landfill 17%, controlled landfill 12%, and dumpsites 13%. Their sum is 100%, using the source's integer percentages without normalization or inferred decimal precision. The World Bank defines references to incineration in this report as incineration with energy recovery. [15]
This is a harmonized, mass-weighted 2022 baseline, built from country observations that predominantly cover 2020–2024 and adjusted for missing flows. It is not a simultaneous 2022 census of every plant. Uncollected waste is a separate category; adding self-managed burning or dumping as new slices would count some flows twice. Neither the recycling slice nor the composting-and-digestion slice should be interpreted as a yield of saleable material. [15]
The commercial implication is an analytical judgment: spending opportunities differ between an unserved collection area and a mature market upgrading material quality. The chart shows the physical system's structure, without allocating revenue to companies or including every industrial waste stream.
Supporting EvidenceOpen the publisher’s original
-
CC BY 3.0 IGO
Cited in: The global municipal waste processing mix
Citation context
The global municipal waste processing mixAdapted from World Bank data under CC BY 3.0 IGO . The views and interpretations in the adaptation are the report authors’ and are not endorsed by the World Bank.
Shares of global municipal solid waste generated by mass; World Bank's modeled 2022 baseline. National observations are harmonized and weighted by 2022 waste generation. Published integer percentages sum to 100%. This chart is not company market share or a breakdown of all solid-waste streams.
Use the seven original published percentages directly. 17+15+6+20+17+12+13=100. No normalization, midpoint substitution, or reverse calculation of absolute tonnes.
2022 baseline modeled/weighted aggregate. National treatment observations can come from differing years, predominantly 2020-24. Shares are weighted by 2022 waste generation. Original country and city data are adjusted for missing flows including uncollected waste, informal-sector collection and nonhousehold MSW. See section 1.2, printed pages 5-7, and Appendix C.
Use the report's seven categories as published. Uncollected waste remains a distinct category; do not add self-managed uncollected burning, dumping, recycling or composting as additional slices.
No separate unknown slice is published in Figure 2.16. This does not imply every physical flow was measured: World Bank notes conservative model adjustments may still leave unrecorded flows.
Original Figure 2.16 says Incineration. Section 1.2 printed p. 5 / PDF p. 41 expressly defines all incineration references in the report as incineration with energy recovery. Recycling is separately classified from composting and anaerobic digestion; no unsupported reuse expansion.
The seven published shares are uncollected 17%, recycling 15%, composting and anaerobic digestion 6%, incineration with energy recovery 20%, sanitary landfill 17%, controlled landfill 12%, and dumpsites 13%. Their sum is 100%, using the source's integer percentages without normalization or inferred decimal precision. The World Bank defines references to incineration in this report as incineration with energy recovery. [15]
This is a harmonized, mass-weighted 2022 baseline, built from country observations that predominantly cover 2020–2024 and adjusted for missing flows. It is not a simultaneous 2022 census of every plant. Uncollected waste is a separate category; adding self-managed burning or dumping as new slices would count some flows twice. Neither the recycling slice nor the composting-and-digestion slice should be interpreted as a yield of saleable material. [15]
The commercial implication is an analytical judgment: spending opportunities differ between an unserved collection area and a mature market upgrading material quality. The chart shows the physical system's structure, without allocating revenue to companies or including every industrial waste stream.
-
Download original data (CSV)
Cited in: The global municipal waste processing mix
Citation context
The global municipal waste processing mixDownload editable SVG · Download original data (CSV)
Shares of global municipal solid waste generated by mass; World Bank's modeled 2022 baseline. National observations are harmonized and weighted by 2022 waste generation. Published integer percentages sum to 100%. This chart is not company market share or a breakdown of all solid-waste streams.
Use the seven original published percentages directly. 17+15+6+20+17+12+13=100. No normalization, midpoint substitution, or reverse calculation of absolute tonnes.
2022 baseline modeled/weighted aggregate. National treatment observations can come from differing years, predominantly 2020-24. Shares are weighted by 2022 waste generation. Original country and city data are adjusted for missing flows including uncollected waste, informal-sector collection and nonhousehold MSW. See section 1.2, printed pages 5-7, and Appendix C.
Use the report's seven categories as published. Uncollected waste remains a distinct category; do not add self-managed uncollected burning, dumping, recycling or composting as additional slices.
No separate unknown slice is published in Figure 2.16. This does not imply every physical flow was measured: World Bank notes conservative model adjustments may still leave unrecorded flows.
Original Figure 2.16 says Incineration. Section 1.2 printed p. 5 / PDF p. 41 expressly defines all incineration references in the report as incineration with energy recovery. Recycling is separately classified from composting and anaerobic digestion; no unsupported reuse expansion.
The seven published shares are uncollected 17%, recycling 15%, composting and anaerobic digestion 6%, incineration with energy recovery 20%, sanitary landfill 17%, controlled landfill 12%, and dumpsites 13%. Their sum is 100%, using the source's integer percentages without normalization or inferred decimal precision. The World Bank defines references to incineration in this report as incineration with energy recovery. [15]
This is a harmonized, mass-weighted 2022 baseline, built from country observations that predominantly cover 2020–2024 and adjusted for missing flows. It is not a simultaneous 2022 census of every plant. Uncollected waste is a separate category; adding self-managed burning or dumping as new slices would count some flows twice. Neither the recycling slice nor the composting-and-digestion slice should be interpreted as a yield of saleable material. [15]
The commercial implication is an analytical judgment: spending opportunities differ between an unserved collection area and a mature market upgrading material quality. The chart shows the physical system's structure, without allocating revenue to companies or including every industrial waste stream.
-
Talks on global plastic pollution treaty adjourn without consensus
Cited in: Supporting Evidence
Citation context
Supporting EvidenceOpen the publisher’s original
-
New Chair elected to lead negotiations on global plastic pollution treaty
Cited in: Supporting Evidence
Citation context
Supporting EvidenceOpen the publisher’s original
-
The Sanitary Fill Method of Refuse Disposal
Cited in: Supporting Evidence
Citation context
Supporting EvidenceOpen the publisher’s original
-
New Law to Control Hazardous Wastes, End Open Dumping, Promote Conservation of Resources
Cited in: Supporting Evidence
Citation context
Supporting EvidenceOpen the publisher’s original
-
Basel Convention on the Control of Transboundary Movements of Hazardous Wastes and their Disposal: Text and Annexes
Cited in: Supporting Evidence
Citation context
Supporting EvidenceOpen the publisher’s original
-
Directive 2008/98/EC of the European Parliament and of the Council of 19 November 2008 on waste and repealing certain Directives
Cited in: Supporting Evidence
Citation context
Supporting EvidenceOpen the publisher’s original
-
Announcement on Matters Concerning the Comprehensive Prohibition of Solid Waste Imports (Announcement No. 53 of 2020; translated title)
Cited in: Supporting Evidence
Citation context
Supporting EvidenceOpen the publisher’s original
-
Circular Economy
Cited in: Supporting Evidence
Citation context
Supporting EvidenceOpen the publisher’s original
-
Global Plastics Outlook: Economic Drivers, Environmental Impacts and Policy Options
Cited in: Supporting Evidence
Citation context
Supporting EvidenceOpen the publisher’s original
-
Global Methane Assessment: Benefits and Costs of Mitigating Methane Emissions — Summary for Decision Makers
Cited in: Supporting Evidence
Citation context
Supporting EvidenceOpen the publisher’s original
-
Monitoring trade in plastic waste and scrap 2026
Cited in: Supporting Evidence
Citation context
Supporting EvidenceOpen the publisher’s original
-
Global Waste Management Outlook 2024: Beyond an Age of Waste — Turning Rubbish into a Resource
Cited in: Supporting Evidence
Citation context
Supporting EvidenceOpen the publisher’s original
-
Packaging waste
Cited in: Supporting Evidence
Citation context
Supporting EvidenceOpen the publisher’s original
-
517 kg of municipal waste per capita generated in 2024; Municipal waste statistics
Cited in: Supporting Evidence
Citation context
Supporting EvidenceOpen the publisher’s original
-
517 kg of municipal waste per capita generated in 2024; Municipal waste statistics
Cited in: Supporting Evidence
Citation context
Supporting EvidenceRelated original 1
-
Advancing Sustainable Materials Management: 2018 Tables and Figures
Cited in: Supporting Evidence
Citation context
Supporting EvidenceOpen the publisher’s original
-
Advancing Sustainable Materials Management: 2018 Tables and Figures
Cited in: Supporting Evidence
Citation context
Supporting EvidenceRelated original 1
-
2025 Report on the State of the Ecology and Environment in China
Cited in: Supporting Evidence
Citation context
Supporting EvidenceOpen the publisher’s original
-
2025 Report on the State of the Ecology and Environment in China
Cited in: Supporting Evidence
Citation context
Supporting EvidenceRelated original 1
-
Waste statistics
Cited in: Supporting Evidence
Citation context
Supporting EvidenceOpen the publisher’s original
-
Construction and Demolition Debris: Material-Specific Data
Cited in: Supporting Evidence
Citation context
Supporting EvidenceOpen the publisher’s original
-
Guide for Industrial Waste Management (draft), EPA 530-R-99-001
Cited in: Supporting Evidence
Citation context
Supporting EvidenceOpen the publisher’s original
-
2024 Annual Report of Ecological and Environmental Statistics
Cited in: Supporting Evidence
Citation context
Supporting EvidenceOpen the publisher’s original
-
Public global company-share data feasibility audit
Cited in: Supporting Evidence
Citation context
Supporting EvidenceOpen the publisher’s original
-
Public global company-share data feasibility audit
Cited in: Supporting Evidence
Citation context
Supporting EvidenceRelated original 1
-
Public global company-share data feasibility audit
Cited in: Supporting Evidence
Citation context
Supporting EvidenceRelated original 2
-
WM Announces Fourth Quarter and Full-Year 2025 Earnings
Cited in: Supporting Evidence
Citation context
Supporting EvidenceOpen the publisher’s original
-
Republic Services Reports Fourth Quarter and Full-Year 2025 Results
Cited in: Supporting Evidence
Citation context
Supporting EvidenceOpen the publisher’s original
-
Waste Connections Reports Fourth Quarter 2025 Results and Provides 2026 Outlook
Cited in: Supporting Evidence
Citation context
Supporting EvidenceOpen the publisher’s original
-
Veolia Annual Results 2025
Cited in: Supporting Evidence
Citation context
Supporting EvidenceOpen the publisher’s original
-
TOMRA publishes Annual Report 2025 Circular Foundations
Cited in: Supporting Evidence
Citation context
Supporting EvidenceOpen the publisher’s original
-
Sims Limited Annual Report 2025
Cited in: Supporting Evidence
Citation context
Supporting EvidenceOpen the publisher’s original
-
SUEZ 2025 results investor presentation
Cited in: Supporting Evidence
Citation context
Supporting EvidenceOpen the publisher’s original
-
AUTOSORT automated sorting systems for recycling
Cited in: Supporting Evidence
Citation context
Supporting EvidenceOpen the publisher’s original
-
Kanadevia Inova wins contract to supply two new lines at Schwandorf waste-to-energy plant
Cited in: Supporting Evidence
Citation context
Supporting EvidenceOpen the publisher’s original
-
The Global E-waste Monitor 2024
Cited in: Supporting Evidence
Citation context
Supporting EvidenceOpen the publisher’s original
-
Growth in waste recovery in 2022
Cited in: Supporting Evidence
Citation context
Supporting EvidenceOpen the publisher’s original
-
View unchanged 3008 × 2008 photograph
Cited in: I01 · Cover photograph and image evidence
Citation context · 2 locations
I01 · Cover photograph and image evidenceView unchanged 3008 × 2008 photograph
Photo: STEINERT, ‘STEINERT UniSort PR’ (29 January 2019), via Wikimedia Commons, CC BY 4.0. Original photograph unchanged; web display resized and may be cropped to fit. No endorsement implied.
I01 · Cover photograph and image evidencePublisher’s original image
Photo: STEINERT, ‘STEINERT UniSort PR’ (29 January 2019), via Wikimedia Commons, CC BY 4.0. Original photograph unchanged; web display resized and may be cropped to fit. No endorsement implied.